1. A sample of the final exam scores in a large introductory math course is as follows 85 60 65 7o 84 75 42 50 75 37 80 73 88 89 85 80 96 99 68 95 a. Use Table in Appendix of most books to obtain the normal score, to construct a normal probability plot of the given data; (use excel sheet); b. Use part (A) to identify outliers; c. Use part (A) to access the normality of the variable under consideration.
1. A sample of the final exam scores in a large introductory math course is as follows 85 60 65 7o 84 75 42 50 75 37 80 73 88 89 85 80 96 99 68 95 a. Use Table in Appendix of most books to obtain the normal score, to construct a normal probability plot of the given data; (use excel sheet); b. Use part (A) to identify outliers; c. Use part (A) to access the normality of the variable under consideration.

Glencoe Algebra 1, Student Edition, 9780079039897, 0079039898, 2018
18th Edition
ISBN:9780079039897
Author:Carter
Publisher:Carter
Chapter10: Statistics
Section10.4: Distributions Of Data
Problem 19PFA

Related questions
Question
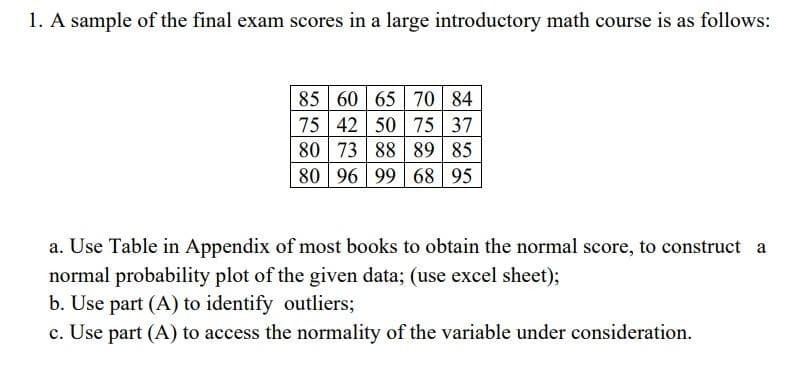
Transcribed Image Text:1. A sample of the final exam scores in a large introductory math course is as follows:
85 60 65 70 84
75 42 50 75 37
80 73 88 89 85
80 96 99 68 95
a. Use Table in Appendix of most books to obtain the normal score, to construct a
normal probability plot of the given data; (use excel sheet);
b. Use part (A) to identify outliers%3;
c. Use part (A) to access the normality of the variable under consideration.
Expert Solution
This question has been solved!
Explore an expertly crafted, step-by-step solution for a thorough understanding of key concepts.

Step by step
Solved in 3 steps with 2 images

Recommended textbooks for you
Glencoe Algebra 1, Student Edition, 9780079039897…
Algebra
ISBN:
9780079039897
Author:
Carter
Publisher:
McGraw Hill
Glencoe Algebra 1, Student Edition, 9780079039897…
Algebra
ISBN:
9780079039897
Author:
Carter
Publisher:
McGraw Hill