1. A study asked students to report their height and then compare to the actual measured height. Assume that the paired sample data are simple random samples and the differences have a distribution that is approximately normal. Reported Height Measured Height | 67.9 68 71 63 70 71 60 65 64 54 63 66 72 69.9 64.9 68.3 70.3 60.6 64.5 67 55.6 74.2 65 70.8 a) State the null and alternative hypotheses. b) Use EXCEL to construct a 99% confidence interval estimate of the difference of means between reported heights and measured heights. Attach your printout to this question, where the reported height is column A, measured height in column B, and the difference in column C. i) Open Excel and click DATA on the ribbon of the Excel. ii) Click Data Analysis. If Data Analysis is not available, please follow the instructions in Assignment 1. iii) Select Descriptive Statistics and click OK. iv) Enter the range of the heights including the label (A1:A13). v) Select Labels in First Row. vi) Select Summary statistics. vii) Select Confidence Level for Mean and type in 99 and click OK. Calculate and write down the 99% confidence interval by hand based on the result you get from the Excel (keep four decimal places in your final answer). c) Interpret the resulting confidence interval.
1. A study asked students to report their height and then compare to the actual measured height. Assume that the paired sample data are simple random samples and the differences have a distribution that is approximately normal. Reported Height Measured Height | 67.9 68 71 63 70 71 60 65 64 54 63 66 72 69.9 64.9 68.3 70.3 60.6 64.5 67 55.6 74.2 65 70.8 a) State the null and alternative hypotheses. b) Use EXCEL to construct a 99% confidence interval estimate of the difference of means between reported heights and measured heights. Attach your printout to this question, where the reported height is column A, measured height in column B, and the difference in column C. i) Open Excel and click DATA on the ribbon of the Excel. ii) Click Data Analysis. If Data Analysis is not available, please follow the instructions in Assignment 1. iii) Select Descriptive Statistics and click OK. iv) Enter the range of the heights including the label (A1:A13). v) Select Labels in First Row. vi) Select Summary statistics. vii) Select Confidence Level for Mean and type in 99 and click OK. Calculate and write down the 99% confidence interval by hand based on the result you get from the Excel (keep four decimal places in your final answer). c) Interpret the resulting confidence interval.

Glencoe Algebra 1, Student Edition, 9780079039897, 0079039898, 2018
18th Edition
ISBN:9780079039897
Author:Carter
Publisher:Carter
Chapter10: Statistics
Section10.4: Distributions Of Data
Problem 19PFA

Related questions
Question
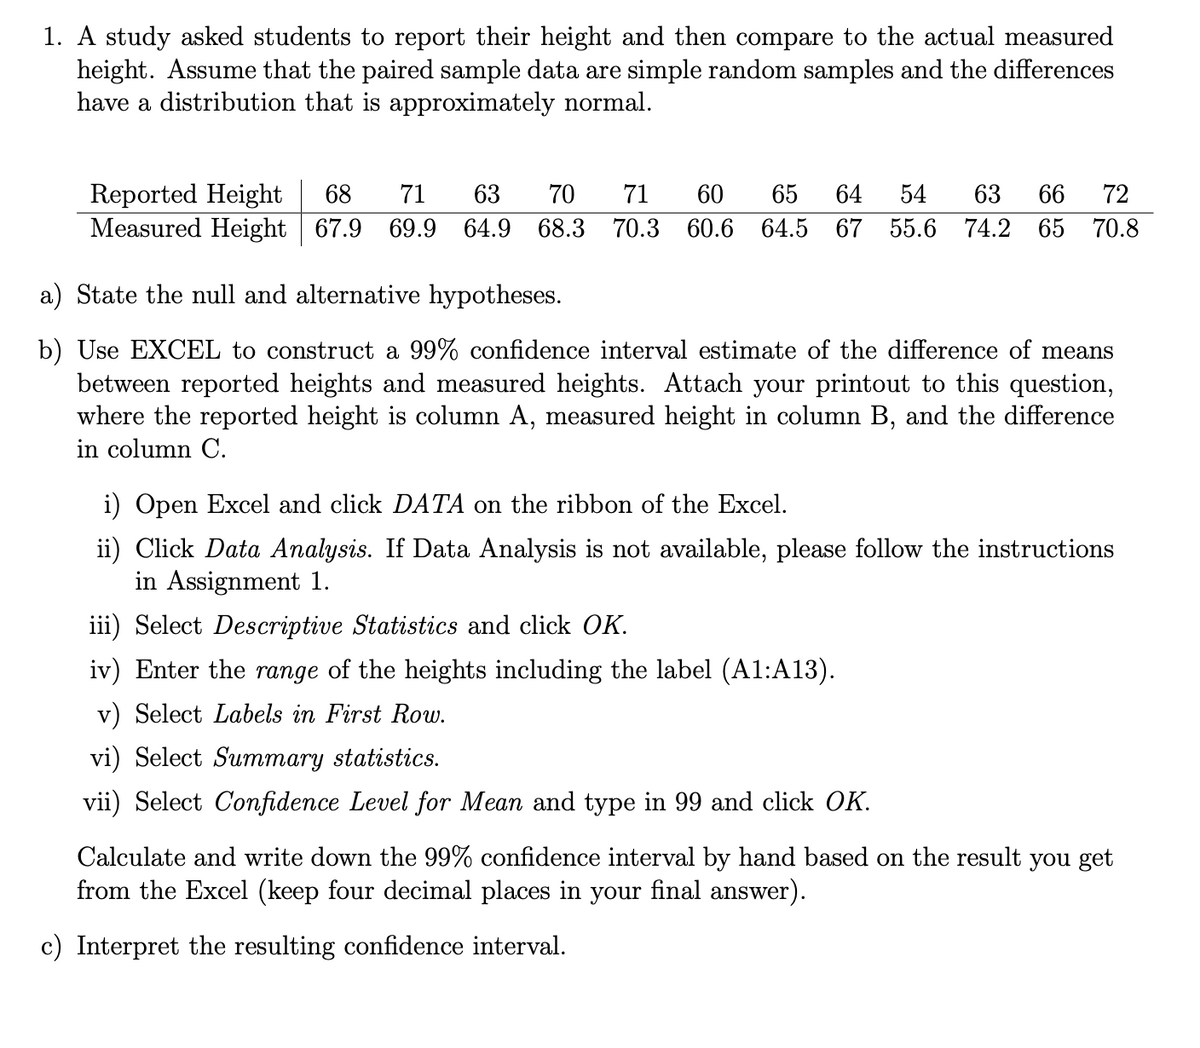
Transcribed Image Text:1. A study asked students to report their height and then compare to the actual measured
height. Assume that the paired sample data are simple random samples and the differences
have a distribution that is approximately normal.
Reported Height
Measured Height 67.9 69.9 64.9 68.3
68
71
63
70
71
60
65
64
54
63
66
72
70.3 60.6 64.5 67 55.6 74.2 65 70.8
a) State the null and alternative hypotheses.
b) Use EXCEL to construct a 99% confidence interval estimate of the difference of means
between reported heights and measured heights. Attach your printout to this question,
where the reported height is column A, measured height in column B, and the difference
in column C.
i) Open Excel and click DATA on the ribbon of the Excel.
ii) Click Data Analysis. If Data Analysis is not available, please follow the instructions
in Assignment 1.
iii) Select Descriptive Statistics and click OK.
iv) Enter the range of the heights including the label (A1:A13).
v) Select Labels in First Row.
vi) Select Summary statistics.
vii) Select Confidence Level for Mean and type in 99 and click OK.
Calculate and write down the 99% confidence interval by hand based on the result you get
from the Excel (keep four decimal places in your final answer).
c) Interpret the resulting confidence interval.
Expert Solution
This question has been solved!
Explore an expertly crafted, step-by-step solution for a thorough understanding of key concepts.

This is a popular solution!

Trending now
This is a popular solution!

Step by step
Solved in 3 steps with 3 images

Recommended textbooks for you
Glencoe Algebra 1, Student Edition, 9780079039897…
Algebra
ISBN:
9780079039897
Author:
Carter
Publisher:
McGraw Hill
Glencoe Algebra 1, Student Edition, 9780079039897…
Algebra
ISBN:
9780079039897
Author:
Carter
Publisher:
McGraw Hill