1. An experiment was conducted to find out if the amount of fertilizer can affect the growth of a plant. All the other factors that is necessary for nourishment are given uniform amount. Every 2 weeks the number of full grown leaves are counted to be deemed as the growth of each plant. Amount of Fertilizer Number of Leaves Grown Applied (grams) 25 g 10 20 g 8 15 g 10 g 4 5 g 1. Plot the graph of the variables by placing the dependent variable on y axis, while the independent variable on the x axis. Questions 1. How does the line graph looks like? 2. What is the dependent variable? the independent variable?
1. An experiment was conducted to find out if the amount of fertilizer can affect the growth of a plant. All the other factors that is necessary for nourishment are given uniform amount. Every 2 weeks the number of full grown leaves are counted to be deemed as the growth of each plant. Amount of Fertilizer Number of Leaves Grown Applied (grams) 25 g 10 20 g 8 15 g 10 g 4 5 g 1. Plot the graph of the variables by placing the dependent variable on y axis, while the independent variable on the x axis. Questions 1. How does the line graph looks like? 2. What is the dependent variable? the independent variable?

College Physics
10th Edition
ISBN:9781285737027
Author:Raymond A. Serway, Chris Vuille
Publisher:Raymond A. Serway, Chris Vuille
Chapter1: Introduction
Section: Chapter Questions
Problem 31P: (a) About how many microorganisms are found in the human intestinal tract? (A typical bacterial...

Related questions
Question
100%
please answer questions 1 and 2
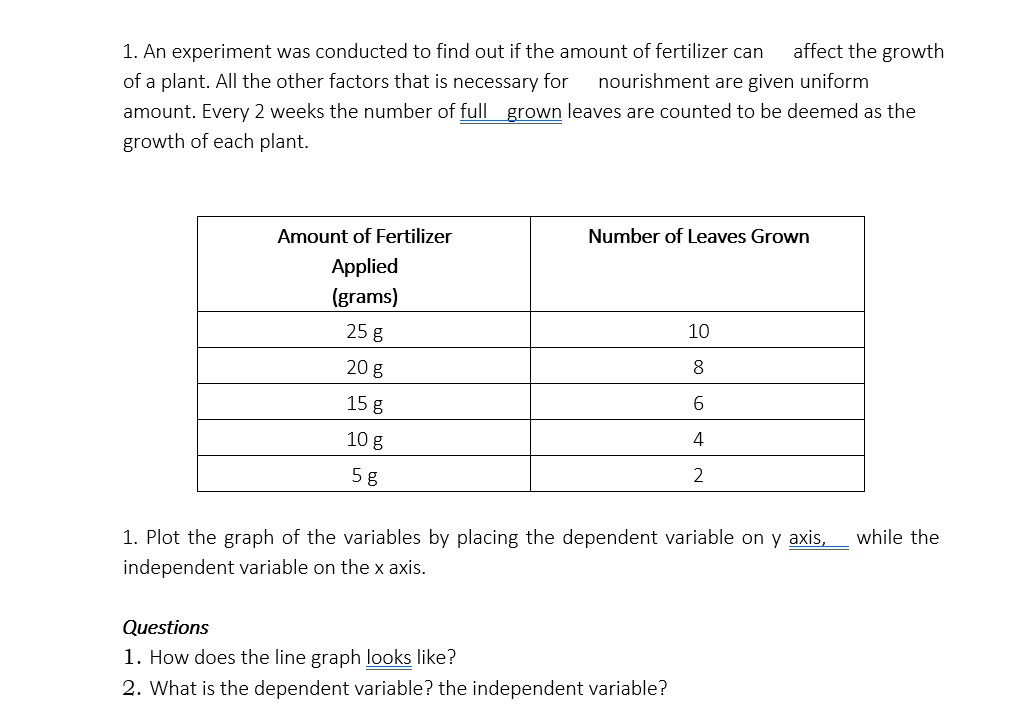
Transcribed Image Text:1. An experiment was conducted to find out if the amount of fertilizer can
affect the growth
of a plant. All the other factors that is necessary for
nourishment are given uniform
amount. Every 2 weeks the number of fullgrown leaves are counted to be deemed as the
growth of each plant.
Amount of Fertilizer
Number of Leaves Grown
Applied
(grams)
25 g
10
20 g
8
15 g
6.
10 g
4
5 g
2
1. Plot the graph of the variables by placing the dependent variable on y axis,
while the
independent variable on the x axis.
Questions
1. How does the line graph looks like?
2. What is the dependent variable? the independent variable?
Expert Solution
This question has been solved!
Explore an expertly crafted, step-by-step solution for a thorough understanding of key concepts.

Step by step
Solved in 3 steps with 3 images

Recommended textbooks for you
College Physics
Physics
ISBN:
9781285737027
Author:
Raymond A. Serway, Chris Vuille
Publisher:
Cengage Learning

An Introduction to Physical Science
Physics
ISBN:
9781305079137
Author:
James Shipman, Jerry D. Wilson, Charles A. Higgins, Omar Torres
Publisher:
Cengage Learning

Physics for Scientists and Engineers, Technology …
Physics
ISBN:
9781305116399
Author:
Raymond A. Serway, John W. Jewett
Publisher:
Cengage Learning
College Physics
Physics
ISBN:
9781285737027
Author:
Raymond A. Serway, Chris Vuille
Publisher:
Cengage Learning
An Introduction to Physical Science
Physics
ISBN:
9781305079137
Author:
James Shipman, Jerry D. Wilson, Charles A. Higgins, Omar Torres
Publisher:
Cengage Learning
Physics for Scientists and Engineers, Technology …
Physics
ISBN:
9781305116399
Author:
Raymond A. Serway, John W. Jewett
Publisher:
Cengage Learning

Horizons: Exploring the Universe (MindTap Course …
Physics
ISBN:
9781305960961
Author:
Michael A. Seeds, Dana Backman
Publisher:
Cengage Learning