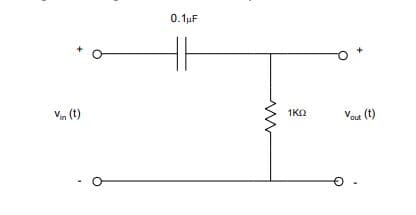
1. Calculate the transfer function T() or H() for Circuit 1. Use impedances instead of resistances for all components, and solve for the complex ratio of the output phasor voltage to the input phasor voltage; this complex quantity is called the transfer function. Record the result below.
1. Calculate the transfer function T() or H() for Circuit 1. Use impedances instead of resistances for all components, and solve for the complex ratio of the output phasor voltage to the input phasor voltage; this complex quantity is called the transfer function. Record the result below.

Power System Analysis and Design (MindTap Course List)
6th Edition
ISBN:9781305632134
Author:J. Duncan Glover, Thomas Overbye, Mulukutla S. Sarma
Publisher:J. Duncan Glover, Thomas Overbye, Mulukutla S. Sarma
Chapter11: Transient Stability
Section: Chapter Questions
Problem 11.6P

Related questions
Question
Transcribed Image Text:+
Vin (1)
-
0.1 F
1 ΚΩ
Vout (t)
Ⓒ
![1. Calculate the transfer function T() or H() for Circuit 1. Use impedances instead of resistances
for all components, and solve for the complex ratio of the output phasor voltage to the input phasor
voltage; this complex quantity is called the transfer function. Record the result below.
2. Using the sinusoidal signal source at 5 [Vpp] (or any other convenient voltage), measure the
frequency response of your circuit from 10 [Hz] to 100 [kHz]. The frequency response is made up
of two parts; the gain, or magnitude response, and the phase response, which is the phase shift
between the output and input sinusoids. Pick several frequencies, and plot the magnitude and the
phase of the frequency response as a function of log(o). Plot the magnitude in deciBels (dB). Plot
the phase as a linear function, but again as a function of log(). These two plots are the magnitude
and phase Bode plots for the circuit.
When you pick the frequencies to measure, pick several in each decade, and a couple of extra
points near to where the response is varying rapidly. Typically, this occurs near the break points of
the response, i.e. where the slope of the magnitude plot changes. The break point frequency is
often called the 3[dB] frequency for reasons that will not be discussed here. For the purposes of
this experiment, we will define a break point frequency as the point of change of slope in the
magnitude Bode plot.
3. On the same Bode plots you constructed from your measurements, plot the transfer function that
you calculated in part 1. Compare the Bode plots you measured and theoretical Bode plots. Do the
locations of the break points agree? Does the phase plot run as expected? They should be close,
within the tolerances of your components and equipment. Explain any significant differences, or
repeat measurements where significant deviations occur. Be careful to plot the frequency response
as a function of log (o), not log (f). In general, a Bode plot can be made either way, but using log
() facilities the comparison with the calculated transfer function.
4. The slope of the magnitude plot where it is increasing at a constant rate should be 20[dB/dec] for
circuits such as that in Figure 1. Measure the slope at this point and state its value below.](/v2/_next/image?url=https%3A%2F%2Fcontent.bartleby.com%2Fqna-images%2Fquestion%2F1d201c9c-25ee-4236-836f-72837ff5cefb%2F6a23b8c3-544a-4d87-8a7f-8b0e65aab921%2Fwg1wsa_processed.jpeg&w=3840&q=75)
Transcribed Image Text:1. Calculate the transfer function T() or H() for Circuit 1. Use impedances instead of resistances
for all components, and solve for the complex ratio of the output phasor voltage to the input phasor
voltage; this complex quantity is called the transfer function. Record the result below.
2. Using the sinusoidal signal source at 5 [Vpp] (or any other convenient voltage), measure the
frequency response of your circuit from 10 [Hz] to 100 [kHz]. The frequency response is made up
of two parts; the gain, or magnitude response, and the phase response, which is the phase shift
between the output and input sinusoids. Pick several frequencies, and plot the magnitude and the
phase of the frequency response as a function of log(o). Plot the magnitude in deciBels (dB). Plot
the phase as a linear function, but again as a function of log(). These two plots are the magnitude
and phase Bode plots for the circuit.
When you pick the frequencies to measure, pick several in each decade, and a couple of extra
points near to where the response is varying rapidly. Typically, this occurs near the break points of
the response, i.e. where the slope of the magnitude plot changes. The break point frequency is
often called the 3[dB] frequency for reasons that will not be discussed here. For the purposes of
this experiment, we will define a break point frequency as the point of change of slope in the
magnitude Bode plot.
3. On the same Bode plots you constructed from your measurements, plot the transfer function that
you calculated in part 1. Compare the Bode plots you measured and theoretical Bode plots. Do the
locations of the break points agree? Does the phase plot run as expected? They should be close,
within the tolerances of your components and equipment. Explain any significant differences, or
repeat measurements where significant deviations occur. Be careful to plot the frequency response
as a function of log (o), not log (f). In general, a Bode plot can be made either way, but using log
() facilities the comparison with the calculated transfer function.
4. The slope of the magnitude plot where it is increasing at a constant rate should be 20[dB/dec] for
circuits such as that in Figure 1. Measure the slope at this point and state its value below.
Expert Solution
This question has been solved!
Explore an expertly crafted, step-by-step solution for a thorough understanding of key concepts.

This is a popular solution!

Trending now
This is a popular solution!

Step by step
Solved in 3 steps with 2 images

Knowledge Booster


Learn more about
Need a deep-dive on the concept behind this application? Look no further. Learn more about this topic, electrical-engineering and related others by exploring similar questions and additional content below.Recommended textbooks for you
Power System Analysis and Design (MindTap Course …
Electrical Engineering
ISBN:
9781305632134
Author:
J. Duncan Glover, Thomas Overbye, Mulukutla S. Sarma
Publisher:
Cengage Learning

Electricity for Refrigeration, Heating, and Air C…
Mechanical Engineering
ISBN:
9781337399128
Author:
Russell E. Smith
Publisher:
Cengage Learning
Power System Analysis and Design (MindTap Course …
Electrical Engineering
ISBN:
9781305632134
Author:
J. Duncan Glover, Thomas Overbye, Mulukutla S. Sarma
Publisher:
Cengage Learning
Electricity for Refrigeration, Heating, and Air C…
Mechanical Engineering
ISBN:
9781337399128
Author:
Russell E. Smith
Publisher:
Cengage Learning