1. Consider that 2 investment funds exist. ABC Fund(invested in 50% normal stock and 50% risky bonds) and 123 Fund(invested in 25% High risk stock and 75% normal bonds). Assume you have the following historical data of annual returns: Return S.D. Normal Stock 8% 20% Risky Bonds High Risk Stock 10% 35% 14% 40% Normal Bonds 6% 10% A. If Normal Stock and Risky Bonds have a correlation coefficient of 0.4 and High Risk Stock and Normal Bonds have correlation coefficient of 0 .2. Find the expected return and standard deviation of each Fund. B. Find the optimal risky portfolio if you could only use these two funds; assume the two funds have a correlation coefficient of 0.3. (To do this use excel and create 101 different combination of the two funds, where allocation or "w" for fund ABC is 0, then.01, then .02 and so forth until w=1. For each of these points calculate the Sharpe ratio. Graph these results with returns on the y axis and S.D on the x axis. Remember to report the return and standard deviation of the optimal risky portfolio.) The risk free rate is .02. (Turn in graph) C. No need to show any work, just explain you reasoning. If the correlation coefficient was .4 would that lead to a better or a worse optimal risky portfolio? If another fund was added would this make things better or worse?
1. Consider that 2 investment funds exist. ABC Fund(invested in 50% normal stock and 50% risky bonds) and 123 Fund(invested in 25% High risk stock and 75% normal bonds). Assume you have the following historical data of annual returns: Return S.D. Normal Stock 8% 20% Risky Bonds High Risk Stock 10% 35% 14% 40% Normal Bonds 6% 10% A. If Normal Stock and Risky Bonds have a correlation coefficient of 0.4 and High Risk Stock and Normal Bonds have correlation coefficient of 0 .2. Find the expected return and standard deviation of each Fund. B. Find the optimal risky portfolio if you could only use these two funds; assume the two funds have a correlation coefficient of 0.3. (To do this use excel and create 101 different combination of the two funds, where allocation or "w" for fund ABC is 0, then.01, then .02 and so forth until w=1. For each of these points calculate the Sharpe ratio. Graph these results with returns on the y axis and S.D on the x axis. Remember to report the return and standard deviation of the optimal risky portfolio.) The risk free rate is .02. (Turn in graph) C. No need to show any work, just explain you reasoning. If the correlation coefficient was .4 would that lead to a better or a worse optimal risky portfolio? If another fund was added would this make things better or worse?

Chapter8: Analysis Of Risk And Return
Section: Chapter Questions
Problem 5P

Related questions
Question
A and B only
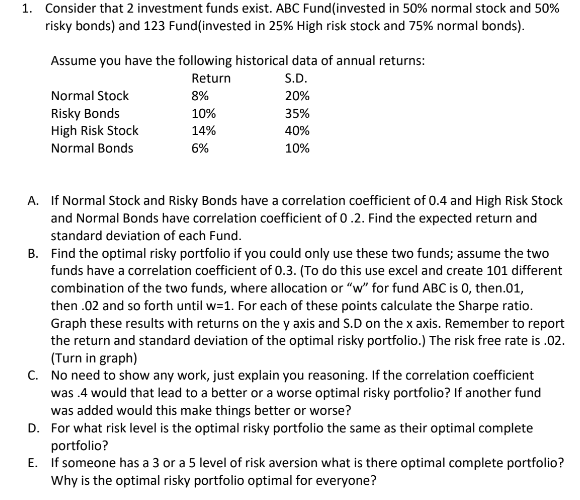
Transcribed Image Text:1. Consider that 2 investment funds exist. ABC Fund(invested in 50% normal stock and 50%
risky bonds) and 123 Fund(invested in 25% High risk stock and 75% normal bonds).
Assume you have the following historical data of annual returns:
Return
S.D.
Normal Stock
8%
20%
Risky Bonds
High Risk Stock
10%
35%
14%
40%
Normal Bonds
6%
10%
A. If Normal Stock and Risky Bonds have a correlation coefficient of 0.4 and High Risk Stock
and Normal Bonds have correlation coefficient of 0.2. Find the expected return and
standard deviation of each Fund.
B. Find the optimal risky portfolio if you could only use these two funds; assume the two
funds have a correlation coefficient of 0.3. (To do this use excel and create 101 different
combination of the two funds, where allocation or "w" for fund ABC is 0, then.01,
then .02 and so forth until w=1. For each of these points calculate the Sharpe ratio.
Graph these results with returns on the y axis and S.D on the x axis. Remember to report
the return and standard deviation of the optimal risky portfolio.) The risk free rate is .02.
(Turn in graph)
C. No need to show any work, just explain you reasoning. If the correlation coefficient
was .4 would that lead to a better or a worse optimal risky portfolio? If another fund
was added would this make things better or worse?
D. For what risk level is the optimal risky portfolio the same as their optimal complete
portfolio?
E. If someone has a 3 or a 5 level of risk aversion what is there optimal complete portfolio?
Why is the optimal risky portfolio optimal for everyone?
Expert Solution
This question has been solved!
Explore an expertly crafted, step-by-step solution for a thorough understanding of key concepts.

This is a popular solution!

Trending now
This is a popular solution!

Step by step
Solved in 5 steps with 3 images

Knowledge Booster


Learn more about
Need a deep-dive on the concept behind this application? Look no further. Learn more about this topic, accounting and related others by exploring similar questions and additional content below.Recommended textbooks for you
EBK CONTEMPORARY FINANCIAL MANAGEMENT
Finance
ISBN:
9781337514835
Author:
MOYER
Publisher:
CENGAGE LEARNING - CONSIGNMENT

PFIN (with PFIN Online, 1 term (6 months) Printed…
Finance
ISBN:
9781337117005
Author:
Randall Billingsley, Lawrence J. Gitman, Michael D. Joehnk
Publisher:
Cengage Learning

Pfin (with Mindtap, 1 Term Printed Access Card) (…
Finance
ISBN:
9780357033609
Author:
Randall Billingsley, Lawrence J. Gitman, Michael D. Joehnk
Publisher:
Cengage Learning
EBK CONTEMPORARY FINANCIAL MANAGEMENT
Finance
ISBN:
9781337514835
Author:
MOYER
Publisher:
CENGAGE LEARNING - CONSIGNMENT
PFIN (with PFIN Online, 1 term (6 months) Printed…
Finance
ISBN:
9781337117005
Author:
Randall Billingsley, Lawrence J. Gitman, Michael D. Joehnk
Publisher:
Cengage Learning
Pfin (with Mindtap, 1 Term Printed Access Card) (…
Finance
ISBN:
9780357033609
Author:
Randall Billingsley, Lawrence J. Gitman, Michael D. Joehnk
Publisher:
Cengage Learning

Essentials of Business Analytics (MindTap Course …
Statistics
ISBN:
9781305627734
Author:
Jeffrey D. Camm, James J. Cochran, Michael J. Fry, Jeffrey W. Ohlmann, David R. Anderson
Publisher:
Cengage Learning

Intermediate Financial Management (MindTap Course…
Finance
ISBN:
9781337395083
Author:
Eugene F. Brigham, Phillip R. Daves
Publisher:
Cengage Learning