1. Consider the following sales figures for the past five years. Year 1 2 3 4 5 Sales 135 142 150 145 160 (a) Use simple average to forecast sales for this year (year 6). (b) Use moving average with n = 2 to forecast sales for this year. (c) Use exponential smoothing with a = 0.1 and an initial forecast value of 150 to forecast sales for this year. (d) Use linear regression to forecast sales for this year.
1. Consider the following sales figures for the past five years. Year 1 2 3 4 5 Sales 135 142 150 145 160 (a) Use simple average to forecast sales for this year (year 6). (b) Use moving average with n = 2 to forecast sales for this year. (c) Use exponential smoothing with a = 0.1 and an initial forecast value of 150 to forecast sales for this year. (d) Use linear regression to forecast sales for this year.

Functions and Change: A Modeling Approach to College Algebra (MindTap Course List)
6th Edition
ISBN:9781337111348
Author:Bruce Crauder, Benny Evans, Alan Noell
Publisher:Bruce Crauder, Benny Evans, Alan Noell
Chapter5: A Survey Of Other Common Functions
Section5.6: Higher-degree Polynomials And Rational Functions
Problem 1TU: The following fictitious table shows kryptonite price, in dollar per gram, t years after 2006. t=...

Related questions
Question
Depart only and
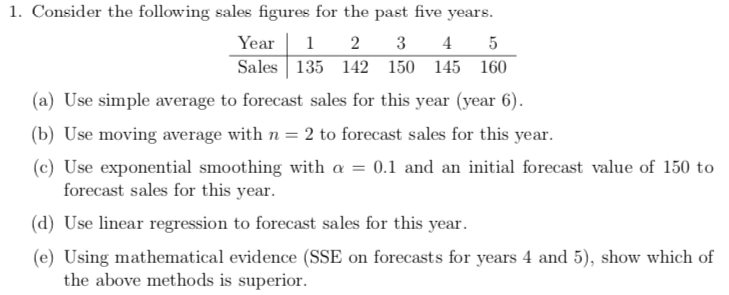
Transcribed Image Text:1. Consider the following sales figures for the past five years.
Year 12 3 45
Sales 135 142 150 145 160
(a) Use simple average to forecast sales for this year (year 6).
(b) Use moving average with n = 2 to forecast sales for this year.
(c) Use exponential smoothing with a = 0.1 and an initial forecast value of 150 to
forecast sales for this year.
(d) Use linear regression to forecast sales for this year.
(e) Using mathematical evidence (SSE on forecasts for years 4 and 5), show which of
the above methods is superior.
Expert Solution
This question has been solved!
Explore an expertly crafted, step-by-step solution for a thorough understanding of key concepts.

Step by step
Solved in 3 steps with 3 images

Recommended textbooks for you
Functions and Change: A Modeling Approach to Coll…
Algebra
ISBN:
9781337111348
Author:
Bruce Crauder, Benny Evans, Alan Noell
Publisher:
Cengage Learning

College Algebra
Algebra
ISBN:
9781305115545
Author:
James Stewart, Lothar Redlin, Saleem Watson
Publisher:
Cengage Learning

Algebra and Trigonometry (MindTap Course List)
Algebra
ISBN:
9781305071742
Author:
James Stewart, Lothar Redlin, Saleem Watson
Publisher:
Cengage Learning
Functions and Change: A Modeling Approach to Coll…
Algebra
ISBN:
9781337111348
Author:
Bruce Crauder, Benny Evans, Alan Noell
Publisher:
Cengage Learning
College Algebra
Algebra
ISBN:
9781305115545
Author:
James Stewart, Lothar Redlin, Saleem Watson
Publisher:
Cengage Learning
Algebra and Trigonometry (MindTap Course List)
Algebra
ISBN:
9781305071742
Author:
James Stewart, Lothar Redlin, Saleem Watson
Publisher:
Cengage Learning