1. Consider the monthly sales data given in Table 1. Month Sales (in thousands) Jan Feb Mar Apr May Jun Jul Aug Sep Oct Nov Dec 1212 1321 1278 1341 1257 1287 1189 1111 1145 1150 1298 1331 These are monthly sales (in thousands of dollars) for a one-year period. Sales forecasts for the next several months are needed in order to plan for raw material purchases, factory labour and plant equipment utilization and financial projections. The simplest forecasts based on past data would be to calculate the average monthly sales and us that average value ($1243.33) as a forecast for future months. However, as time passes
1. Consider the monthly sales data given in Table 1. Month Sales (in thousands) Jan Feb Mar Apr May Jun Jul Aug Sep Oct Nov Dec 1212 1321 1278 1341 1257 1287 1189 1111 1145 1150 1298 1331 These are monthly sales (in thousands of dollars) for a one-year period. Sales forecasts for the next several months are needed in order to plan for raw material purchases, factory labour and plant equipment utilization and financial projections. The simplest forecasts based on past data would be to calculate the average monthly sales and us that average value ($1243.33) as a forecast for future months. However, as time passes

College Algebra
7th Edition
ISBN:9781305115545
Author:James Stewart, Lothar Redlin, Saleem Watson
Publisher:James Stewart, Lothar Redlin, Saleem Watson
Chapter5: Systems Of Equations And Inequalities
Section: Chapter Questions
Problem 14P: Annual interest yield refer to problem 13 .suppose the investor decides to increase the maximum...

Related questions
Question
Transcribed Image Text:TUTORIAL I TIME SERIES
1.
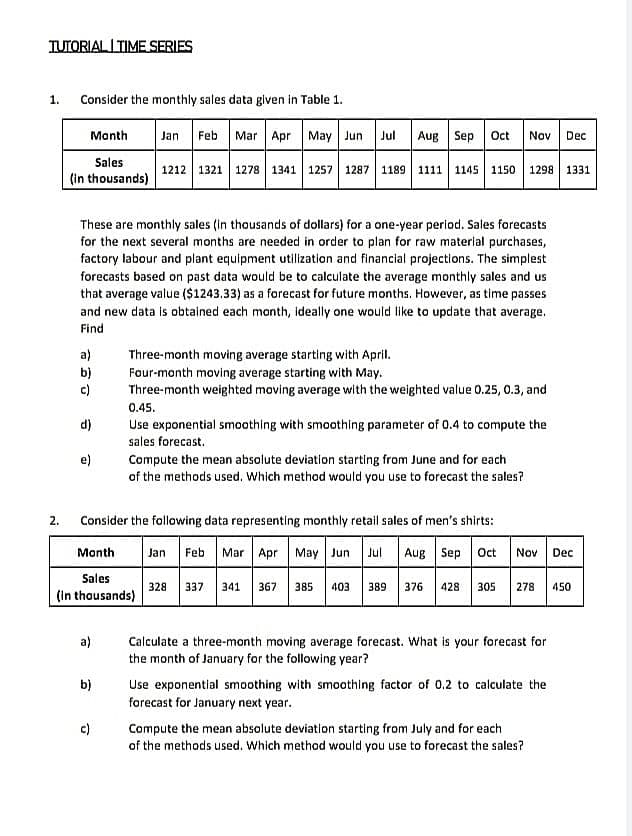
Consider the monthly sales data given in Table 1.
2.
Month
Sales
(in thousands)
a)
b)
c)
d)
These are monthly sales (in thousands of dollars) for a one-year period. Sales forecasts
for the next several months are needed in order to plan for raw material purchases,
factory labour and plant equipment utilization and financial projections. The simplest
forecasts based on past data would be to calculate the average monthly sales and us
that average value ($1243.33) as a forecast for future months. However, as time passes
and new data is obtained each month, ideally one would like to update that average.
Find
e)
a)
Jan Feb Mar Apr May Jun Jul Aug Sep Oct
b)
c)
1212 1321 1278 1341 1257 1287 1189 1111 1145 1150 1298 1331
Consider the following data representing monthly retail sales of men's shirts:
Month
Sales
(in thousands)
Nov Dec
Three-month moving average starting with April.
Four-month moving average starting with May.
Three-month weighted moving average with the weighted value 0.25, 0.3, and
0.45.
Use exponential smoothing with smoothing parameter of 0.4 to compute the
sales forecast.
Compute the mean absolute deviation starting from June and for each
of the methods used. Which method would you use to forecast the sales?
Jan Feb Mar Apr May Jun Jul Aug Sep Oct Nov Dec
328 337 341 367 385 403 389 376 428 305 278 450
Calculate a three-month moving average forecast. What is your forecast for
the month of January for the following year?
Use exponential smoothing with smoothing factor of 0.2 to calculate the
forecast for January next year.
Compute the mean absolute deviation starting from July and for each
of the methods used. Which method would you use to forecast the sales?
Transcribed Image Text:TUTORIAL I DECISION ANALYSIS
1.
2.
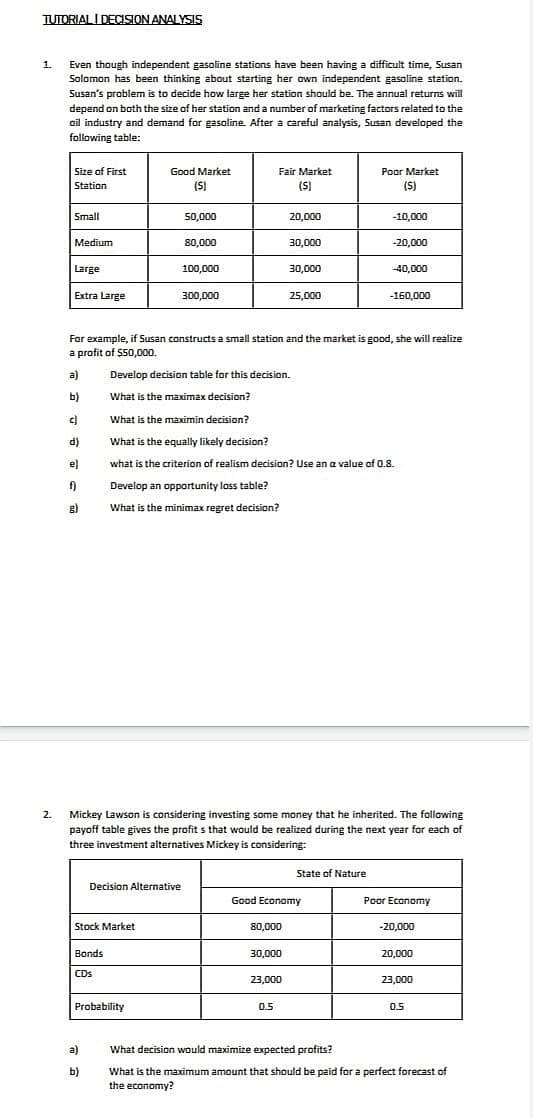
Even though independent gasoline stations have been having a difficult time, Susan
Solomon has been thinking about starting her own independent gasoline station.
Susan's problem is to decide how large her station should be. The annual returns will
depend on both the size of her station and a number of marketing factors related to the
oil industry and demand for gasoline. After a careful analysis, Susan developed the
following table:
Size of First
Station
Small
Medium
Large
Extra Large
cl
d)
e)
f)
Stock Market
Good Market
(S)
Bonds
CDs
Decision Alternative
Probability
a)
b)
50,000
80,000
100,000
300,000
Fair Market
(S)
For example, if Susan constructs a small station and the market is good, she will realize
a profit of $50,000.
a)
Develop decision table for this decision.
b)
What is the maximax decision?
What is the maximin decision?
What is the equally likely decision?
what is the criterion of realism decision? Use an a value of 0.8.
Develop an opportunity loss table?
What is the minimax regret decision?
80,000
20,000
30,000
30,000
Mickey Lawson is considering investing some money that he inherited. The following
payoff table gives the profits that would be realized during the next year for each of
three investment alternatives Mickey is considering:
23,000
0.5
30,000
25,000
Good Economy
Poor Market
(S)
State of Nature
-10,000
-20,000
-40,000
-160,000
Poor Economy
-20,000
20,000
23,000
0.5
What decision would maximize expected profits?
What is the maximum amount that should be paid for a perfect forecast of
the economy?
Expert Solution
This question has been solved!
Explore an expertly crafted, step-by-step solution for a thorough understanding of key concepts.

Step by step
Solved in 6 steps with 13 images

Recommended textbooks for you
College Algebra
Algebra
ISBN:
9781305115545
Author:
James Stewart, Lothar Redlin, Saleem Watson
Publisher:
Cengage Learning
College Algebra
Algebra
ISBN:
9781305115545
Author:
James Stewart, Lothar Redlin, Saleem Watson
Publisher:
Cengage Learning