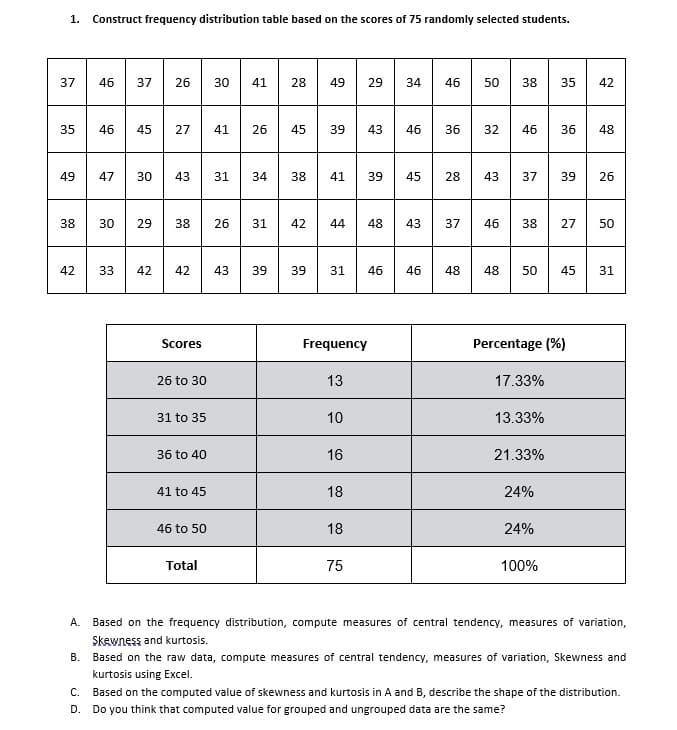
1. Construct frequency distribution table based on the scores of 75 randomly selected students. 37 35 49 38 42 46 37 26 30 41 28 49 29 34 46 46 50 38 35 42 46 45 27 41 26 45 39 43 46 36 47 30 43 31 34 30 29 38 26 31 42 33 42 42 43 39 Scores 26 to 30 31 to 35 36 to 40 41 to 45 46 to 50 38 Total 39 41 39 31 46 Frequency 13 10 16 18 18 75 45 44 48 43 37 46 28 46 32 46 36 48 48 43 48 37 38 27 50 50 17.33% Percentage (%) 13.33% 21.33% 24% 39 26 24% 100% 45 31 A. Based on the frequency distribution, compute measures of central tendency, measures of variation, Skewness and kurtosis. B. Based on the raw data, compute measures of central tendency, measures of variation, Skewness and kurtosis using Excel. C. Based on the computed value of skewness and kurtosis in A and B, describe the shape of the distribution. D. Do you think that computed value for grouped and ungrouped data are the same?
1. Construct frequency distribution table based on the scores of 75 randomly selected students. 37 35 49 38 42 46 37 26 30 41 28 49 29 34 46 46 50 38 35 42 46 45 27 41 26 45 39 43 46 36 47 30 43 31 34 30 29 38 26 31 42 33 42 42 43 39 Scores 26 to 30 31 to 35 36 to 40 41 to 45 46 to 50 38 Total 39 41 39 31 46 Frequency 13 10 16 18 18 75 45 44 48 43 37 46 28 46 32 46 36 48 48 43 48 37 38 27 50 50 17.33% Percentage (%) 13.33% 21.33% 24% 39 26 24% 100% 45 31 A. Based on the frequency distribution, compute measures of central tendency, measures of variation, Skewness and kurtosis. B. Based on the raw data, compute measures of central tendency, measures of variation, Skewness and kurtosis using Excel. C. Based on the computed value of skewness and kurtosis in A and B, describe the shape of the distribution. D. Do you think that computed value for grouped and ungrouped data are the same?

Glencoe Algebra 1, Student Edition, 9780079039897, 0079039898, 2018
18th Edition
ISBN:9780079039897
Author:Carter
Publisher:Carter
Chapter10: Statistics
Section10.6: Summarizing Categorical Data
Problem 4AGP

Related questions
Question
100%
Transcribed Image Text:1. Construct frequency distribution table based on the scores of 75 randomly selected students.
37
35
49
42
46 37 26 30
46 45 27
38 302
47 30 43
C.
D.
33
42
42
Scores
29 38 26 31 42
26 to 30
31 to 35
36 to 40
41 to 45
46 to 50
Total
41 26 45
31
41 28 49 29 34 46 50 38 35
43
34 38
39
39 43
41
39 31
Frequency
13
10
16
44 48 43 37
18
18
39
75
46
46
45
36
28
32
46 36 48
43 37 39 26
46 38
46 48 48
50
17.33%
Percentage (%)
13.33%
21.33%
24%
42
24%
100%
27 50
45 31
A. Based on the frequency distribution, compute measures of central tendency, measures of variation,
Skewness and kurtosis.
B. Based on the raw data, compute measures of central tendency, measures of variation, Skewness and
kurtosis using Excel.
Based on the computed value of skewness and kurtosis in A and B, describe the shape of the distribution.
Do you think that computed value for grouped and ungrouped data are the same?
Expert Solution
This question has been solved!
Explore an expertly crafted, step-by-step solution for a thorough understanding of key concepts.

Step by step
Solved in 6 steps with 9 images

Recommended textbooks for you
Glencoe Algebra 1, Student Edition, 9780079039897…
Algebra
ISBN:
9780079039897
Author:
Carter
Publisher:
McGraw Hill
Glencoe Algebra 1, Student Edition, 9780079039897…
Algebra
ISBN:
9780079039897
Author:
Carter
Publisher:
McGraw Hill