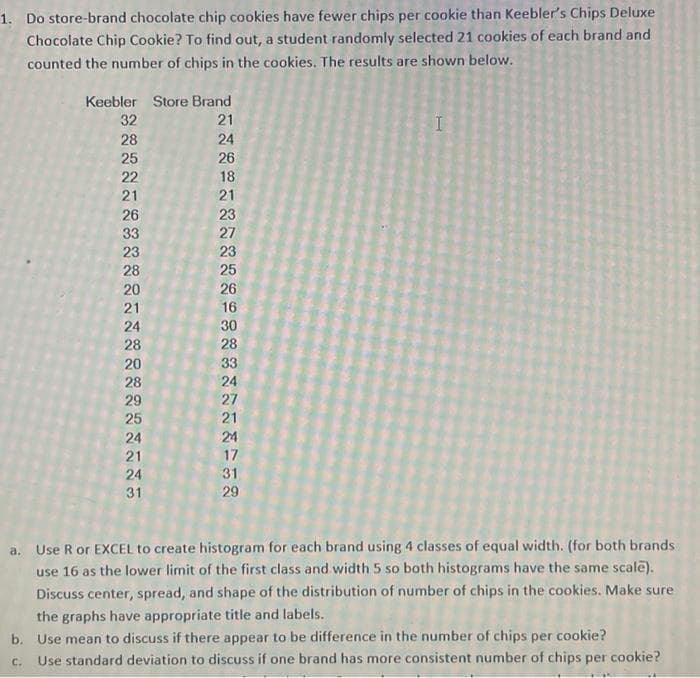
1. Do store-brand chocolate chip cookies have fewer chips per cookie than Keebler's Chips Deluxe Chocolate Chip Cookie? To find out, a student randomly selected 21 cookies of each brand and counted the number of chips in the cookies. The results are shown below. Keebler Store Brand 21 32 28 24 25 22 26 18 21 21 23 27 26 33 23 23 28 25 26 20 21 16 30 28 24 28 20 33 28 24 29 27 25 21 24 24 21 17 24 31 31 29
1. Do store-brand chocolate chip cookies have fewer chips per cookie than Keebler's Chips Deluxe Chocolate Chip Cookie? To find out, a student randomly selected 21 cookies of each brand and counted the number of chips in the cookies. The results are shown below. Keebler Store Brand 21 32 28 24 25 22 26 18 21 21 23 27 26 33 23 23 28 25 26 20 21 16 30 28 24 28 20 33 28 24 29 27 25 21 24 24 21 17 24 31 31 29

Holt Mcdougal Larson Pre-algebra: Student Edition 2012
1st Edition
ISBN:9780547587776
Author:HOLT MCDOUGAL
Publisher:HOLT MCDOUGAL
Chapter11: Data Analysis And Probability
Section11.5: Interpreting Data
Problem 1C

Related questions
Question
Transcribed Image Text:1. Do store-brand chocolate chip cookies have fewer chips per cookie than Keebler's Chips Deluxe
Chocolate Chip Cookie? To find out, a student randomly selected 21 cookies of each brand and
counted the number of chips in the cookies. The results are shown below.
Keebler Store Brand
32
21
28
25
24
26
22
18
21
21
26
23
33
27
23
23
28
25
20
26
21
16
24
30
28
28
20
33
28
24
27
29
25
21
24
24
21
17
24
31
31
29
a. Use R or EXCEL to create histogram for each brand using 4 classes of equal width. (for both brands
use 16 as the lower limit of the first class and width 5 so both histograms have the same scale).
Discuss center, spread, and shape of the distribution of number of chips in the cookies. Make sure
the graphs have appropriate title and labels.
b. Use mean to discuss if there appear to be difference in the number of chips per cookie?
Use standard deviation to discuss if one brand has more consistent number of chips per cookie?
C.
Expert Solution
This question has been solved!
Explore an expertly crafted, step-by-step solution for a thorough understanding of key concepts.

This is a popular solution!

Trending now
This is a popular solution!

Step by step
Solved in 3 steps with 1 images

Recommended textbooks for you
Holt Mcdougal Larson Pre-algebra: Student Edition…
Algebra
ISBN:
9780547587776
Author:
HOLT MCDOUGAL
Publisher:
HOLT MCDOUGAL
Holt Mcdougal Larson Pre-algebra: Student Edition…
Algebra
ISBN:
9780547587776
Author:
HOLT MCDOUGAL
Publisher:
HOLT MCDOUGAL