1. Economic growth around the world The following table reports real income per person for several different economies in the years 1960 and 2010. It also gives each economy's average annual growth rate during his period. For example, real income per person in Niger was $945 in 1960, and it actually declined to $570 by 2010. Niger's average annual growth rate during this period was -1.01%, and it was the poorest economy in the table in the year 2010. The real income-per-person figures are denominated in U.S. dollars with a base year of 2005. The following exercises will help you to understand the different growth experiences of these economies. Economy Canada United Kingdom Korea Hong Kong Guater Niger Real Income per Person in 1960 Real Income per Person in 2010 (Dollars) (Dollars) 12,946 35,810 11,884 32,034 1,610 28,702 4,518 44,070 1,985 3,859 945 570 Annual Growth Rate (Percent) 2.06 2.00 5.93 4.66 1.34 -1.01
1. Economic growth around the world The following table reports real income per person for several different economies in the years 1960 and 2010. It also gives each economy's average annual growth rate during his period. For example, real income per person in Niger was $945 in 1960, and it actually declined to $570 by 2010. Niger's average annual growth rate during this period was -1.01%, and it was the poorest economy in the table in the year 2010. The real income-per-person figures are denominated in U.S. dollars with a base year of 2005. The following exercises will help you to understand the different growth experiences of these economies. Economy Canada United Kingdom Korea Hong Kong Guater Niger Real Income per Person in 1960 Real Income per Person in 2010 (Dollars) (Dollars) 12,946 35,810 11,884 32,034 1,610 28,702 4,518 44,070 1,985 3,859 945 570 Annual Growth Rate (Percent) 2.06 2.00 5.93 4.66 1.34 -1.01

Chapter19: Economic Development
Section: Chapter Questions
Problem 1.1P

Related questions
Question
Transcribed Image Text:1. Economic growth around the world
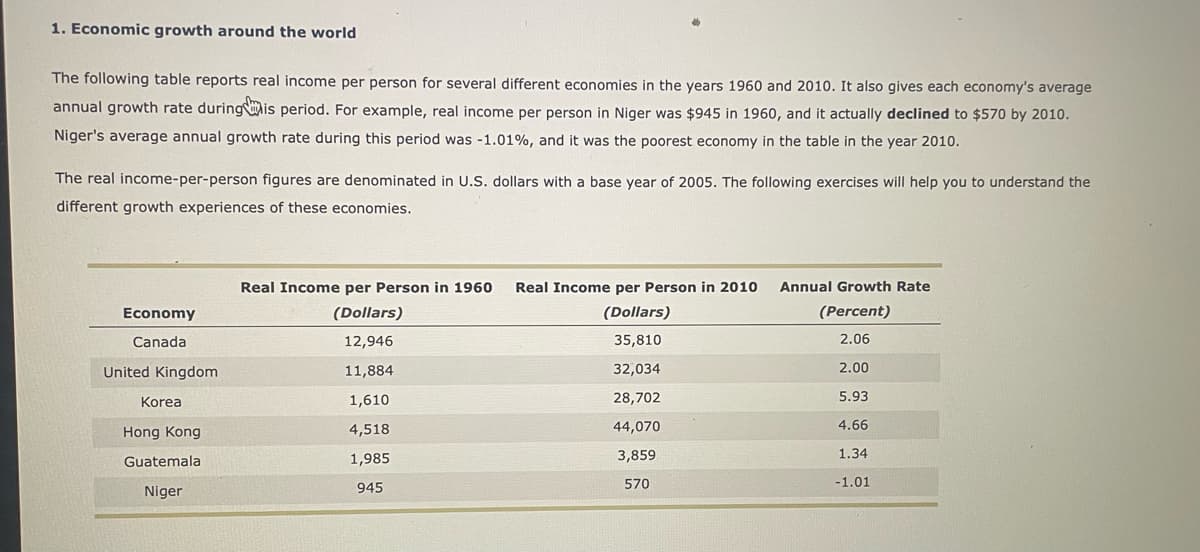
The following table reports real income per person for several different economies in the years 1960 and 2010. It also gives each economy's average
annual growth rate during his period. For example, real income per person in Niger was $945 in 1960, and it actually declined to $570 by 2010.
Niger's average annual growth rate during this period was -1.01%, and it was the poorest economy in the table in the year 2010.
The real income-per-person figures are denominated in U.S. dollars with a base year of 2005. The following exercises will help you to understand the
different growth experiences of these economies.
Economy
Canada
United Kingdom
Korea
Hong Kong
Guatemala
Niger
Real Income per Person in 1960 Real Income per Person in 2010
(Dollars)
(Dollars)
35,810
12,946
11,884
32,034
1,610
28,702
4,518
44,070
1,985
3,859
945
570
Annual Growth Rate
(Percent)
2.06
2.00
5.93
4.66
1.34
-1.01
Transcribed Image Text:S
United Kingdom
Korea
Hong Kong
Guatemala
Niger
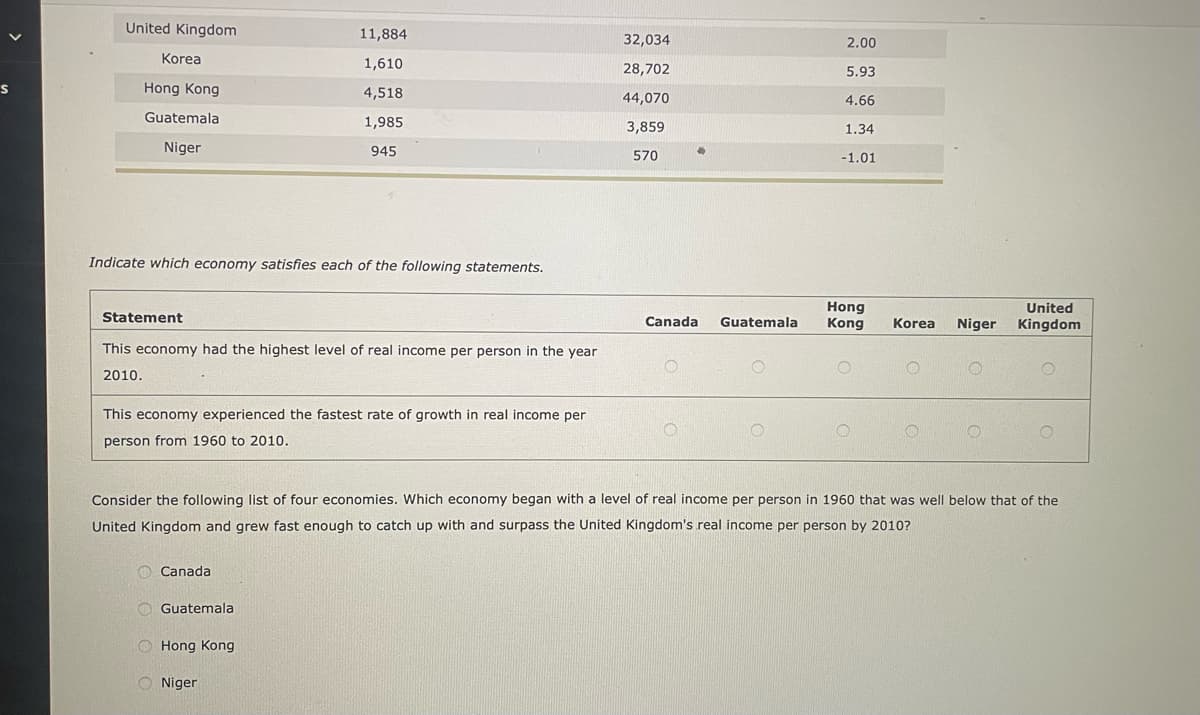
Indicate which economy satisfies each of the following statements.
Statement
This economy had the highest level of real income per person in the year
2010.
11,884
1,610
4,518
1,985
945
This economy experienced the fastest rate of growth in real income per
person from 1960 to 2010.
Canada
Guatemala
Hong Kong
Niger
32,034
28,702
44,070
3,859
570
Canada Guatemala
2.00
5.93
4.66
1.34
-1.01
Consider the following list of four economies. Which economy began with a level of real income per person in 1960 that was well below that of the
United Kingdom and grew fast enough to catch up with and surpass the United Kingdom's real income per person by 2010?
Hong
Kong
United
Korea Niger Kingdom
Expert Solution
This question has been solved!
Explore an expertly crafted, step-by-step solution for a thorough understanding of key concepts.

Step by step
Solved in 2 steps

Knowledge Booster


Learn more about
Need a deep-dive on the concept behind this application? Look no further. Learn more about this topic, economics and related others by exploring similar questions and additional content below.Recommended textbooks for you

Brief Principles of Macroeconomics (MindTap Cours…
Economics
ISBN:
9781337091985
Author:
N. Gregory Mankiw
Publisher:
Cengage Learning

Essentials of Economics (MindTap Course List)
Economics
ISBN:
9781337091992
Author:
N. Gregory Mankiw
Publisher:
Cengage Learning
Brief Principles of Macroeconomics (MindTap Cours…
Economics
ISBN:
9781337091985
Author:
N. Gregory Mankiw
Publisher:
Cengage Learning
Essentials of Economics (MindTap Course List)
Economics
ISBN:
9781337091992
Author:
N. Gregory Mankiw
Publisher:
Cengage Learning

Principles of Economics 2e
Economics
ISBN:
9781947172364
Author:
Steven A. Greenlaw; David Shapiro
Publisher:
OpenStax

Principles of Economics (MindTap Course List)
Economics
ISBN:
9781305585126
Author:
N. Gregory Mankiw
Publisher:
Cengage Learning

Principles of Economics, 7th Edition (MindTap Cou…
Economics
ISBN:
9781285165875
Author:
N. Gregory Mankiw
Publisher:
Cengage Learning