1. For the given data: 48 18 20 21 22 23 24 25 26 27 28 29 30 30 31 31 32 32 33 33 34 35 36 37 38 39 47 53 a. Make a Frequency Diagram with 7 classes. b. Draw the histogram. C. Give the five number summary d. Draw the box and whisker diagram showing the fences, the whiskers, and the outliers.
1. For the given data: 48 18 20 21 22 23 24 25 26 27 28 29 30 30 31 31 32 32 33 33 34 35 36 37 38 39 47 53 a. Make a Frequency Diagram with 7 classes. b. Draw the histogram. C. Give the five number summary d. Draw the box and whisker diagram showing the fences, the whiskers, and the outliers.

Glencoe Algebra 1, Student Edition, 9780079039897, 0079039898, 2018
18th Edition
ISBN:9780079039897
Author:Carter
Publisher:Carter
Chapter10: Statistics
Section10.6: Summarizing Categorical Data
Problem 4DGP

Related questions
Question
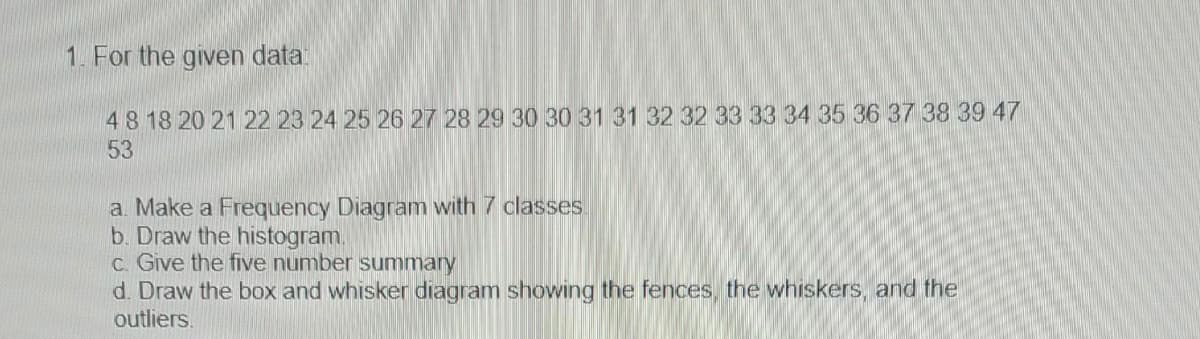
Transcribed Image Text:1. For the given data:
48 18 20 21 22 23 24 25 26 27 28 29 30 30 31 31 32 32 33 33 34 35 36 37 38 39 47
53
a. Make a Frequency Diagram with 7 classes.
b. Draw the histogram.
c. Give the five number summary
d. Draw the box and whisker diagram showing the fences, the whiskers, and the
outliers.
Expert Solution
This question has been solved!
Explore an expertly crafted, step-by-step solution for a thorough understanding of key concepts.

Step by step
Solved in 2 steps with 3 images

Recommended textbooks for you
Glencoe Algebra 1, Student Edition, 9780079039897…
Algebra
ISBN:
9780079039897
Author:
Carter
Publisher:
McGraw Hill
Glencoe Algebra 1, Student Edition, 9780079039897…
Algebra
ISBN:
9780079039897
Author:
Carter
Publisher:
McGraw Hill