1. From statistics grades, John has a mean of 70 and Sx(standard deviation) of 15, Jane has a mean of 70 and Sx (standard deviation) of 5. Hint: create a 68% Range) a. Describe the two students in terms of consistency of their grades and give reason. b. Who is more accurately described as a 60 student and why? c. Who is more likely to do either extremely well or extremely poorly on the next exam?
1. From statistics grades, John has a mean of 70 and Sx(standard deviation) of 15, Jane has a mean of 70 and Sx (standard deviation) of 5. Hint: create a 68% Range) a. Describe the two students in terms of consistency of their grades and give reason. b. Who is more accurately described as a 60 student and why? c. Who is more likely to do either extremely well or extremely poorly on the next exam?

Glencoe Algebra 1, Student Edition, 9780079039897, 0079039898, 2018
18th Edition
ISBN:9780079039897
Author:Carter
Publisher:Carter
Chapter10: Statistics
Section10.4: Distributions Of Data
Problem 19PFA

Related questions
Question
help please its due today i don’t understand
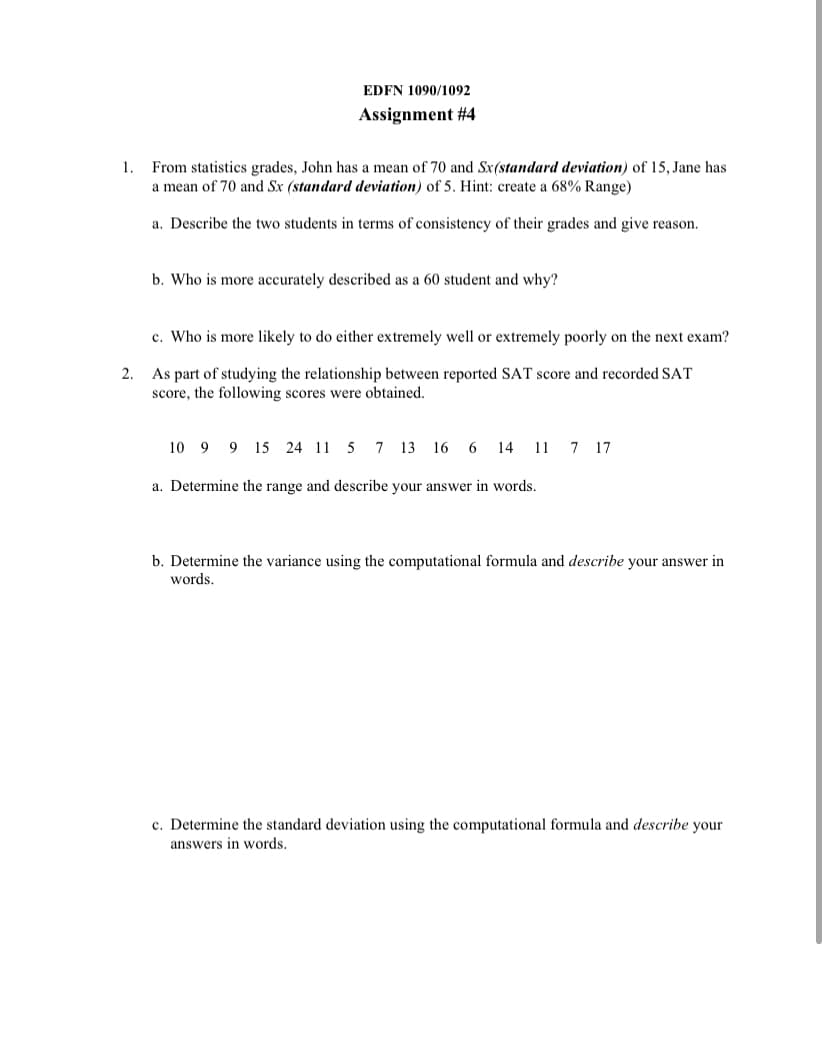
Transcribed Image Text:EDFN 1090/1092
Assignment #4
1. From statistics grades, John has a mean of 70 and Sx(standard deviation) of 15, Jane has
a mean of 70 and Sx (standard deviation) of 5. Hint: create a 68% Range)
a. Describe the two students in terms of consistency of their grades and give reason.
b. Who is more accurately described as a 60 student and why?
c. Who is more likely to do either extremely well or extremely poorly on the next exam?
As part of studying the relationship between reported SAT score and recorded SAT
score, the following scores were obtained.
2.
10 9 9 15 24 11 5 7 13 16 6 14 11 7 17
a. Determine the range and describe your answer in words.
b. Determine the variance using the computational formula and describe your answer in
words.
c. Determine the standard deviation using the computational formula and describe your
answers in words.
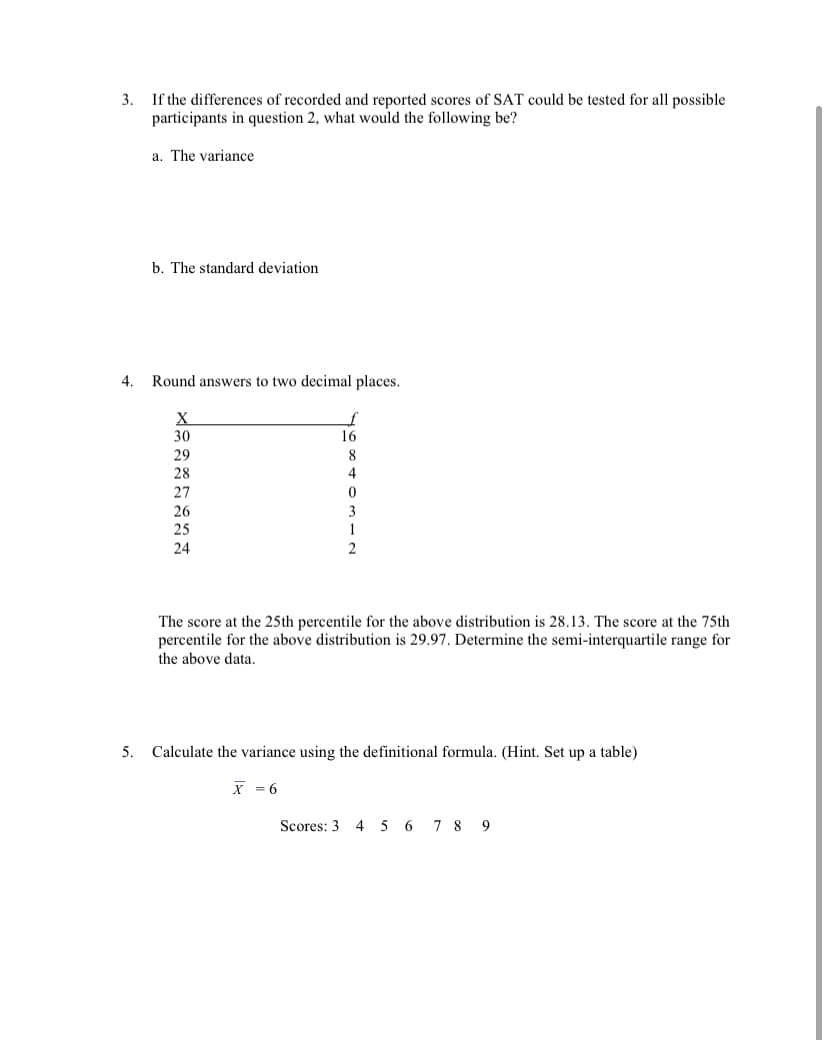
Transcribed Image Text:3.
If the differences of recorded and reported scores of SAT could be tested for all possible
participants in question 2, what would the following be?
a. The variance
b. The standard deviation
4.
Round answers to two decimal places.
X
30
16
29
28
8
4
27
26
25
3
1
24
The score at the 25th percentile for the above distribution is 28.13. The score at the 75th
percentile for the above distribution is 29.97. Determine the semi-interquartile range for
the above data.
5. Calculate the variance using the definitional formula. (Hint. Set up a table)
X = 6
Scores: 3 4 5 6 7 8 9
Expert Solution
This question has been solved!
Explore an expertly crafted, step-by-step solution for a thorough understanding of key concepts.

This is a popular solution!

Trending now
This is a popular solution!

Step by step
Solved in 2 steps with 1 images

Recommended textbooks for you
Glencoe Algebra 1, Student Edition, 9780079039897…
Algebra
ISBN:
9780079039897
Author:
Carter
Publisher:
McGraw Hill
Glencoe Algebra 1, Student Edition, 9780079039897…
Algebra
ISBN:
9780079039897
Author:
Carter
Publisher:
McGraw Hill