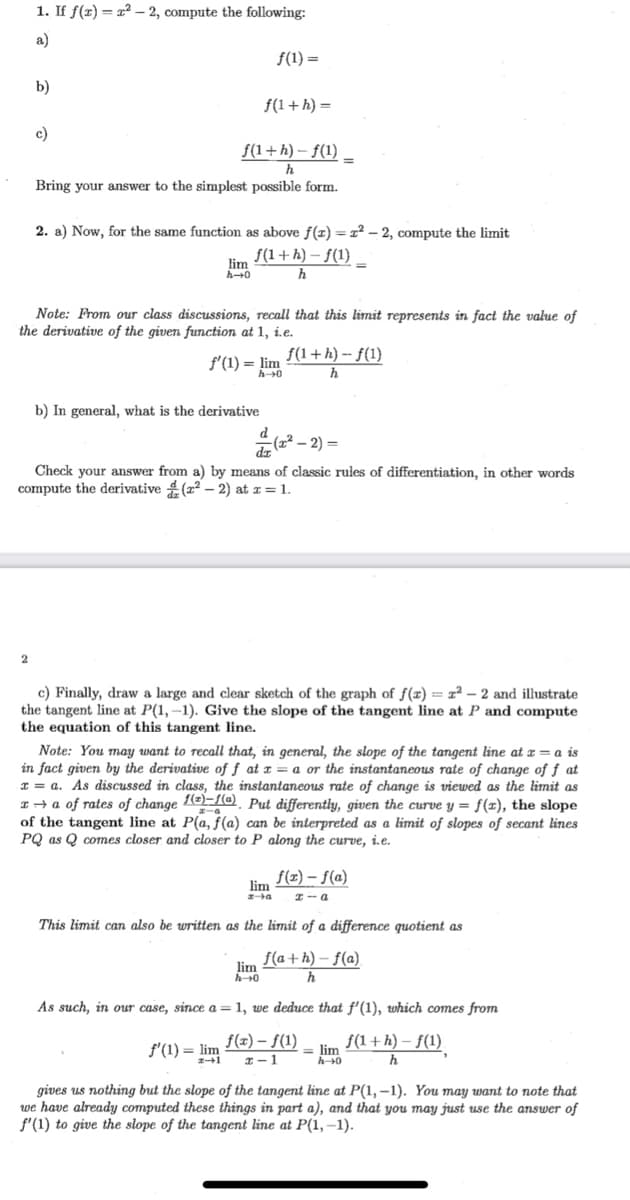
1. If f(r) = x – 2, compute the following: a) f(1) = b) f(1+h} = c) f(1+h) – f(1) Bring your answer to the simplest possible form. 2. a) Now, for the same function as above f(x) = 2² – 2, compute the limit f(1+ h) – f(1) lim Note: From our class discussions, recall that this limit represents in fact the value of the derivative of the given function at 1, i.e. f(1+h) -- f(1) f'(1) = lim h b) In general, what is the derivative (z? - 2) = Check your answer from a) by means of classic rules of differentiation, in other words compute the derivative 4(22 – 2) at z = 1. 2 c) Finally, draw a large and clear sketch of the graph of f(x) = x² – 2 and illustrate the tangent line at P(1, -1). Give the slope of the tangent line at P and compute the equation of this tangent line. Note: You may want to recall that, in general, the slope of the tangent line at a = a is in fact given by the derivative of f at z = a or the instantaneous rate of change of f at I = a. As discussed in class, the instantaneous rate of change is viewed as the limit as I + a of rates of change Le O Put differently, given the curve y = f(x), the slope of the tangent line at P(a, f(a) can be interpreted as a limit of slopes of secant lines PQ as Q comes closer and closer to P along the curve, i.e. f(x) – f(a) lim I-a This limit can also be written as the limit of a difference quotient as f(a+h) – f(a) lim h As such, in our case, since a=1, we deduce that f'(1), whích comes from f'(1) = lim f(z) – f(1) = lim 1+h) –- S(1) h. I-1 gives us nothing but the slope of the tangent line at P(1,–1). You may want to note that we have already computed these things in part a), and that you may just use the answer of f'(1) to give the slope of the tangent line at P(1, –1).


Addition Rule of Probability
It simply refers to the likelihood of an event taking place whenever the occurrence of an event is uncertain. The probability of a single event can be calculated by dividing the number of successful trials of that event by the total number of trials.
Expected Value
When a large number of trials are performed for any random variable ‘X’, the predicted result is most likely the mean of all the outcomes for the random variable and it is known as expected value also known as expectation. The expected value, also known as the expectation, is denoted by: E(X).
Probability Distributions
Understanding probability is necessary to know the probability distributions. In statistics, probability is how the uncertainty of an event is measured. This event can be anything. The most common examples include tossing a coin, rolling a die, or choosing a card. Each of these events has multiple possibilities. Every such possibility is measured with the help of probability. To be more precise, the probability is used for calculating the occurrence of events that may or may not happen. Probability does not give sure results. Unless the probability of any event is 1, the different outcomes may or may not happen in real life, regardless of how less or how more their probability is.
Basic Probability
The simple definition of probability it is a chance of the occurrence of an event. It is defined in numerical form and the probability value is between 0 to 1. The probability value 0 indicates that there is no chance of that event occurring and the probability value 1 indicates that the event will occur. Sum of the probability value must be 1. The probability value is never a negative number. If it happens, then recheck the calculation.

Step by step
Solved in 2 steps


