1. If n2 30 and sample standard deviation is known, the test statistic to be used is: Test Statistic: Z = – Test Statistic: t = A. в.
1. If n2 30 and sample standard deviation is known, the test statistic to be used is: Test Statistic: Z = – Test Statistic: t = A. в.

Glencoe Algebra 1, Student Edition, 9780079039897, 0079039898, 2018
18th Edition
ISBN:9780079039897
Author:Carter
Publisher:Carter
Chapter10: Statistics
Section10.3: Measures Of Spread
Problem 26PFA

Related questions
Question
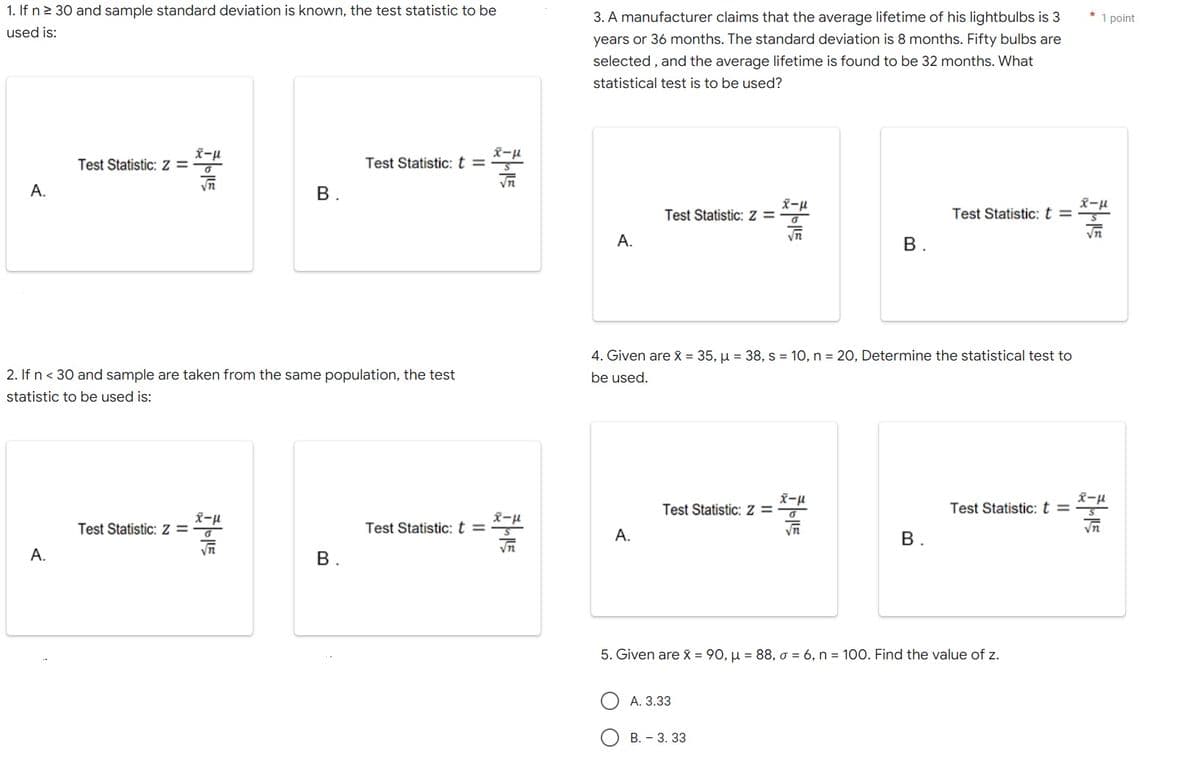
Transcribed Image Text:1. If n2 30 and sample standard deviation is known, the test statistic to be
3. A manufacturer claims that the average lifetime of his lightbulbs is 3
1 point
used is:
years or 36 months. The standard deviation is 8 months. Fifty bulbs are
selected , and the average lifetime is found to be 32 months. What
statistical test is to be used?
x-u
Test Statistic: z=
Test Statistic: t =
А.
B
Test Statistic: Z =¯
Test Statistic: t = -
Vn
А.
В.
4. Given are X = 35, µ = 38, s = 10, n = 20, Determine the statistical test to
2. If n < 30 and sample are taken from the same population, the test
be used.
statistic to be used is:
Test Statistic: z =
x-µ
Test Statistic: t =
Test Statistic: z =-
Test Statistic:t =X-u
A.
vn
В.
А.
5. Given are x = 90, µ = 88, o = 6, n = 100. Find the value of z.
A. 3.33
В. - 3. 33
B.
Expert Solution
This question has been solved!
Explore an expertly crafted, step-by-step solution for a thorough understanding of key concepts.

Step by step
Solved in 2 steps with 1 images

Recommended textbooks for you
Glencoe Algebra 1, Student Edition, 9780079039897…
Algebra
ISBN:
9780079039897
Author:
Carter
Publisher:
McGraw Hill
Glencoe Algebra 1, Student Edition, 9780079039897…
Algebra
ISBN:
9780079039897
Author:
Carter
Publisher:
McGraw Hill