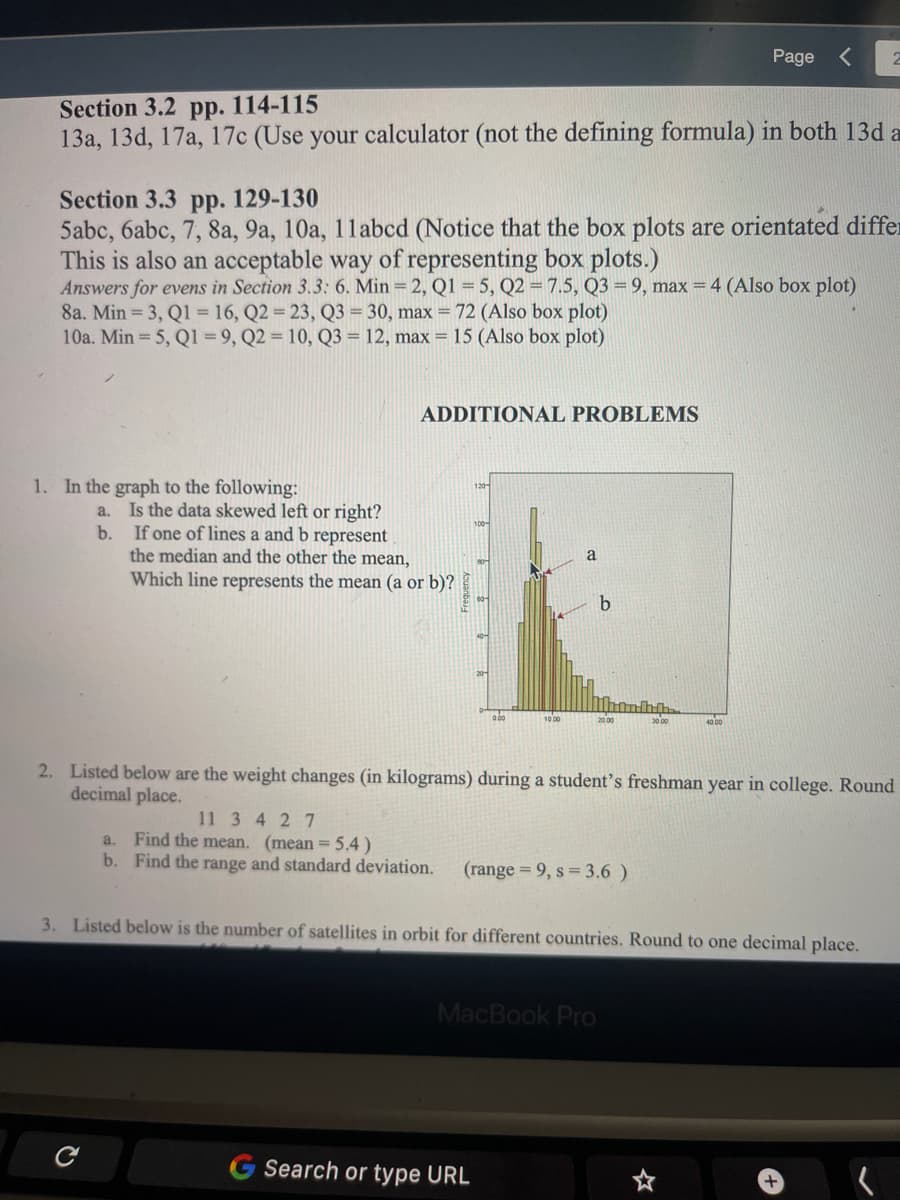
1. In the graph to the following: 120 a. Is the data skewed left or right? b. If one of lines a and b represent the median and the other the mean, Which line represents the mean (a or b)? 100- Aouanbag


Q: A set of data consists of 38 observations. How many classes would you recommend for the frequency…
A:
Q: What dot plot has a median of 5, a range of 10, and a mean of 5?
A: Explanation: Consider the data set is: 0, 5, 10 n = 3 Mean = 0+5+103= 153= 5 Median = n+12thterm=…
Q: For the following data (1, 2, 3, 2, 4, 6, 8, 10) , the median equal
A: “Since you have asked multiple questions, we will solve the first question for you. If you want any…
Q: a. The mean is The median is
A: mean= sum of all observation/number of observations. mode =most occurring value in the data set.…
Q: 3. If the median of the data set x, i ..n? the data set 2x+3. i 1, 1..n, is 10, what is the median…
A:
Q: A middle school wanted to visualize the association between how many days a student is absent and…
A: We have given that the scatter plot of the Number of Absence and the grade. In this scatter plot,…
Q: Below is a histogram of the runlengths of the 150 top-grossing films from 2011. Also shown is an…
A: Given: Below is a histogram of the run lengths of the 150 top- grossing films from 2011. It is shown…
Q: If each of the numbers in the following data set were multiplied by 17, what would be the median of…
A:
Q: The numbers of parking violations on a main street during each hour from 9am to 5pm are listed. 8,…
A: Median is found after arranging the given data in ascending order as below: 8, 12, 18, 21, 25, 28,…
Q: mean? 2. In a normally distributed set of data with µ = 14.7 and o = 3.4, is the score Y = 74…
A: Given : Population Mean,μ = 14.7 Population Standard Deviation,σ = 3.4
Q: #4 Use the graph to the right. Which data set could be used to create the box plot? O 3, 4, 8, 10,…
A: In this question we will use basic of algebra i.e solution from box plot We will use simple…
Q: Find the median of the following data: 1, 6, 12, 19, 5, 0, 6 A. 6 B. 7 C. 19 D. 3.5
A: Consider the provided data; 1, 6, 12, 19, 5, 0, 6. We have to find the median of the given data.…
Q: Find the mean, the median and the mode of the heights.
A: Mean is defined as the sum of observations divided by number of observation. Median is the middle…
Q: Consider the data set {5,2, 5, 3, 4}. What is the geometric mean for this set? Round your answer to…
A: Given query is to find geomagnetic mean of the data set.
Q: If exactly one number in a set of data is changed, will this necessarily change the mean of the set?…
A: For Mean: - We know that the mean is computed by using the sum of all the data points. If one of the…
Q: If the mean is 25 for the data: 20. 30, 15. /24. y.8 find the median O 20 O 53 O 24 O 22
A: We have to find corrcet answer..
Q: For which of the following sets of data should a stacked bar chart be used?
A: *Answer:
Q: For the graph shown, determine which letter represents the mean, the median, and the mode. Letters…
A: From the graph it is clear that, the graph has a symmetric distribution.
Q: 2. 1. What kind of graph was used to show the data? O stem-and-leaf plot O box-and-whisker What in…
A: (1) Clearly from the given figure we can observe.
Q: Find the range of the data set. * 21 22 23 24 25 26 27 28 25 8.
A:
Q: 15. If the first two observations were removed, what will happen to the value of the median ? * C.…
A:
Q: If the mean is 22 for the data: 20, 10, 12, 24, 8, y find the median 12 20 16 58
A: Given the data 20, 10, 12, 24, 8, y with mean 22.
Q: Given the mean of a certain data set as 155, what will be its new mean if all the data points were…
A: Remark: We know that, The mean (average) of a data set is found by adding all numbers in the data…
Q: The data represented by the following stem-and-leaf plot range from to 4189 5 147 6235 769 O A. 49;…
A: Given that Stem and leaf plot Find the range from __ to __
Q: Given the following two sets of data, draw a stem and leaf plot. A: 12, 22, 22, 24, 34, 31, 26, 35,…
A: Given the following two sets of data, draw a stem and leaf plot.A: 12, 22, 22, 24, 34, 31, 26, 35,…
Q: Hello. Can I get help on how to work out this problem? Thank You!
A: Introduction:Symmetric distribution:A symmetric distribution can be defined as one in which the…
Q: If the mean is 25 for the data: 20, 30, 15, 24, у, 8
A: Hello! As you have posted 2 different questions, we are answering the first question (10). In case…
Q: Decide if each situation is 1. The mean can be found by adding all the numbers in a data set and…
A: As per our guidelines we are supposed to answer only 3 subparts. Kindly repost other questions as…
Q: what is the median? b) Q3 is 28. Q1 is 12. What should a data value need to be in order to be an…
A: a) Given, n=66(even) Median=12 n2thobs+n2+1thobs n2th obs=33thobs=16n2+1th obs=34thobs=16 Therefore,…
Q: Given this table, what is the median number of pets. Number Frequency of Pets 8 10 3 1 3.
A: It is an important part of statistics. It is widely used.
Q: For the following ordered data: 7,17,27, 37 Mean= 22 Median
A: Given data, 7,17,27,37 Mean=? Median=? Mode=?
Q: Use the graph to answer the following questions. A B C (a) What is the shape? Select an ans (b)…
A: The given graph is, From the graph, (a) The shape of the graph is right or positive skewed…
Q: The following table shows the number of people and their ages in years: 72 65 33 32 2. 25 ages 4 3…
A: Yes, the mean and median both are misleading as the frequency of the ages is more for lower ages as…
Q: Consider the data set: 4, 5, 5, 5, 6, 6, 8, 9, 11, 12 What would happen to the mean if another data…
A:
Q: If the mean is 25 for the data: 20, 30, 15, 24, y, 8 find the median
A: Given that the mean is= 25 So, (20+30+15+24+y+8)/6 = 25 or, 97+y=150 or, y=53
Q: The following data show the weights (in pounds) of 20 students in a class. Find the median.
A:
Q: The following data points represent the number of patients seen last week at a local clinic: 1, 4,…
A: Given the set of numbers = 1,4,6,11,16,19,21 Firstly sort the data in increasing or decreasing…
Q: Given the mean of a certain data set as 115, what will be its new mean if all the data points were…
A:
Q: Based on the following data set: 150, 180,210,220,250,325 What would be the change to the mean,…
A: Use EXCEL Procedure to obtain the values of mean, median and mode for the original data set.…
Q: For the data set 7 6 4 9 5 the median
A: The median is the middle data point in a sorted data set. The given data set is [7, 6, 4, 9, 5]…
Q: 8. Describe the shape of the data distribution and the location of the mean in relation to the…
A: The box plot is a graphical method to determine the distribution of the data and also good for…
Q: Consider a set of data with a mean 290 and median 220, Q1 = 190, Q3 =240. The 3 smallest…
A: [Note: Since you have posted a question with multiple subparts, we will solve the first three…
Q: If the median of a data set is 760, the upper quartile is 950, and the lower quartile is 650, what…
A: Given: Median = Q2 = 760, Upper quartile = Q3 = 950, Lower quartile = Q1 = 650.
Q: Which of the following could be the median of the waiting times, in minutes? O 17.25 O 15.00 O 12.25…
A: Given: The histogram below displays the frequencies of waiting times, in minutes, for 175 patients…
Q: If the median of a data set is 134 and the mean is 177, which of the following is most likely?
A: Note: Hi there! Thank you for posting the question. As your question has some missing information…
Q: In a certain company, every worker was given a $900 raise. How does this affect the median of the…
A: Given information- We have given that in a certain company, every worker was given a $900 raise. We…
Q: Given the following data: 7, 11, 19, 8, 9, 20, 17, and 16. Identify the range
A:
Q: 2) Make a stem-and-leaf plot of the following data 56, 65, 98, 82, 64, 71, 78, 77, 86, 95, 91, 59,…
A:
Q: A ____ represents the leading digit in a stem-and-leaf plot.
A: A stem and leaf plot displays numerical data by splitting each data point into a "leaf" (usually the…


Trending now
This is a popular solution!

Step by step
Solved in 2 steps with 2 images

- The answer to each of the following questions will be one of the points labeled A-H on the scatterplot. (i) Of the sales that received lower-than-predicted tips, which one had the lowest sale amount? [ Select ] ["D", "E", "A", "B", "F", "H", "G", "C"] (ii) Which sale received the best tip, that is, which sale had the tip that was highest above the tip predicted for it? [ Select ] ["A", "B", "D", "E", "C", "G", "H", "F"] (iii) Which data point has the smallest residual? [ Select ] ["A", "C", "F", "H", "D", "G", "B", "E"] (iv) Of E and F, the model makes a better prediction for [ Select ] ["E", "F"] .he table below shows the mark scheme for three students doing Business and Economic Calculus. Grades in % Course requirements % Kwesi Onaji Chevaneese Zaim Quiz 10% Sectional 30% Assignment 20% Final Exam 40% 60 83 74 92 96 85 86 51 88 90 79 60 94 88 76 81 Which student got the highest overall grade? a. Kwesi b. Onaji c. Chevaneese d. Zaim Instruction:Section 11.2 Question #9 In soccer, serious fouls result in a penalty kick with one kicker and one defending goalkeeper. The accompanying table summarizes results from 292 kicks during games among top teams. In the table, jump direction indicates which way the goalkeeper jumped, where the kick direction is from the perspective of the goalkeeper. Use a 0.05 significance level to test the claim that the direction of the kick is independent of the direction of the goalkeeper jump. Do the results support the theory that because the kicks are so fast, goalkeepers have no time to react, so the directions of their jumps are independent of the directions of the kicks? View the penalty kick data. Pentalty kick data Dialog content starts Goalkeeper Jump Left Center Right Kick to Left 58 1 42 Kick to Center 41 8 29 Kick to Right 46 10 57 Determine the test statistic. χ2=____________(Round to…
- (b) (i) Create boxplots for these two data sets (either drawn by hand or as a printout from Dataplotter or another suitable computer package). Include all the relevant information required for drawing boxplots The summary values can be displayed on the boxplots themselves or in a table to the side of the chart, as they appear in Dataplotter. (ii) Use the boxplot for radio station B to say whether the data are symmetric or skewed. If the data are skewed, then state whether they are skewed to the left or skewed to the right. What does this tell you about the spread of the data for radio station B? (iii) The advertising company tries to summarise what the boxplot for radio station A is saying. Are the following statements true or false? In each case justify your answer. (1) About one-quarter of the reporting periods for radio station A had less than 10 550 000 listeners. (2) About three-quarters of the reporting periods for radio station A had more than 10 900 000 listeners.Jensen Tire & Auto is in the process of deciding whether to purchase a maintenance contract for its new computerized wheel alignment and balancing machine. Managers feel that maintenance expense is related to usage of the machine, and they have collected the following information on weekly usage of the machine (in hours) and annual maintenance expense (in hundreds of dollars) from 10 other companies that own the machine.Company Weekly Usage(hours) Annual maintenance Expense(hundreds of dollars)A 13 17.0B 10 22.0C 20 30.0D 28 37.0E 32 47.0F 17…If there is no seasonal effect on human births, one would expect equal numbers of children to be born in each season (winter, spring, summer, and fall). A student takes a census of her statistics class and finds that of the 120 students in the class, 26 were born in winter, 37 in spring, 31 in summer, and 26 in fall. She wonders if the excess in the spring is an indication that births are not uniform throughout the year. Complete parts a) through c) below. A. What is the expected number of births in each season if there is no "seasonal effect" on births? B. Compute the chi squared-statistic. C. How many degrees of freedom does the chi squared-statistic have?
- In the Focus Problem at the beginning of this chapter, a study was described comparing the hatch ratios of wood duck nesting boxes. Group I nesting boxes were well separated from each other and well hidden by available brush. There were a total of 489 eggs in group I boxes, of which a field count showed about 272 hatched. Group II nesting boxes were placed in highly visible locations and grouped closely together. There were a total of 821 eggs in group II boxes, of which a field count showed about 262 hatched. (a) Find a point estimate p̂1 for p1, the proportion of eggs that hatch in group I nest box placements. (Round your answer to four decimal places.) p̂1 = Find a 95% confidence interval for p1. (Round your answers to three decimal places.) lower limitupper limit (b) Find a point estimate p̂2 for p2, the proportion of eggs that hatch in group II nest box placements. (Round your answer to four decimal places.) p̂2 = Find a 95% confidence interval for p2. (Round your…I need help with numbers, 8, 9, and 10 show formulas and work if neccasary please A random sample of 25 frozen dinners of a certain type was selected from production during a particular period and the calorie content of each one was determined. The resulting observations are: Calories from Frozen Dinners 255 244 239 242 265 245 259 248 225 226 251 233 266 227 246 240 257 222 237 270 230 260 268 231 238 The stated calorie content is 240 calories. At the 5% significance level, do the data suggest that the mean calorie content of the frozen dinners differs from 240 calories? State the null and alternative hypothesis Check the conditions. To determine if the data is approximately normal, using paper and pencil methods, construct a histogram. If the conditions have not been satisfied, still continue with the assignment. State the significance level. and then draw and fully label the rejection regions. Calculate the test statistic and p-value. You may use the calculator…Which of the following is a benefit of a within-groups design over a between-groups design?
- In the Focus Problem at the beginning of this chapter, a study was described comparing the hatch ratios of wood duck nesting boxes. Group I nesting boxes were well separated from each other and well hidden by available brush. There were a total of 485 eggs in group I boxes, of which a field count showed about 274 hatched. Group II nesting boxes were placed in highly visible locations and grouped closely together. There were a total of 790 eggs in group II boxes, of which a field count showed about 262 hatched. (a) Find a point estimate p̂1 for p1, the proportion of eggs that hatch in group I nest box placements. (Round your answer to three decimal places.)p̂1 = Find a 95% confidence interval for p1. (Round your answers to three decimal places.) lower limit upper limit (b) Find a point estimate p̂2 for p2, the proportion of eggs that hatch in group II nest box placements. (Round your answer to three decimal places.)p̂2 = Find a 95% confidence interval for p2. (Round…Johnson Filtration, Inc. provides maintenance service for water-filtration systems. Suppose that in addition to information on the number of months since the machine was serviced and whether a mechanical or an electrical repair was necessary, the managers obtained a list showing which repairperson performed the service. Repair Time(hours) Months SinceLast Service Type ofRepair Repairperson 2.9 2 electrical Dave Newton 3.0 6 mechanical Dave Newton 4.8 8 electrical Bob Jones 1.8 3 mechanical Dave Newton 2.9 2 electrical Dave Newton 4.9 7 electrical Bob Jones 4.2 9 mechanical Bob Jones 4.8 8 mechanical Bob Jones 4.4 4 electrical Bob Jones 4.5 6 electrical Dave Newton Ignore for now the months since the last maintenance service (x1 ) and the repairperson who performed the service. Develop the estimated simple linear regression equation to predict the repair time (y) given the…Three girls (Alice, Barbara, and Connie) and four boys (David, Edward, Frank, and George) arrangedthemselves in a straight line so that the distribution of boys and girls was symmetrical about the middleperson.1. David stood somewhere to the left of Alice and somewhere to the right of Edward.2. Frank was somewhere to the left of both Edward and George.3. Connie was positioned somewhere to the right of George.What was their order in the line?