1. In the United States, 2013 was a bad year for growing wheat. And as wheat supply decreased, the price of wheat rose dramatically, leading to a lower quantity demanded (a movement along the demand curve). The accompanying table describes what happened to prices and the quantity of wheat demanded. a. Using the midpoint method, calculate the price elasticity of demand for winter wheat. b. What is the total revenue for U.S. wheat farmers in 2012 and 2013? 2012 2013 Quantity demanded (billions of bushels) 2.2 Average price (per bushel) 2.0 $3.42 $4.26 c. Did the bad harvest increase or decrease the total revenue of U.S. wheat farmers? How could have predicted this from your answer to part a? you
1. In the United States, 2013 was a bad year for growing wheat. And as wheat supply decreased, the price of wheat rose dramatically, leading to a lower quantity demanded (a movement along the demand curve). The accompanying table describes what happened to prices and the quantity of wheat demanded. a. Using the midpoint method, calculate the price elasticity of demand for winter wheat. b. What is the total revenue for U.S. wheat farmers in 2012 and 2013? 2012 2013 Quantity demanded (billions of bushels) 2.2 Average price (per bushel) 2.0 $3.42 $4.26 c. Did the bad harvest increase or decrease the total revenue of U.S. wheat farmers? How could have predicted this from your answer to part a? you

Principles of Microeconomics (MindTap Course List)
8th Edition
ISBN:9781305971493
Author:N. Gregory Mankiw
Publisher:N. Gregory Mankiw
Chapter5: Elastic And Its Application
Section: Chapter Questions
Problem 6CQQ: Over time, technological advance increases consumers incomes and reduces the price of smartphones....

Related questions
Question
100%
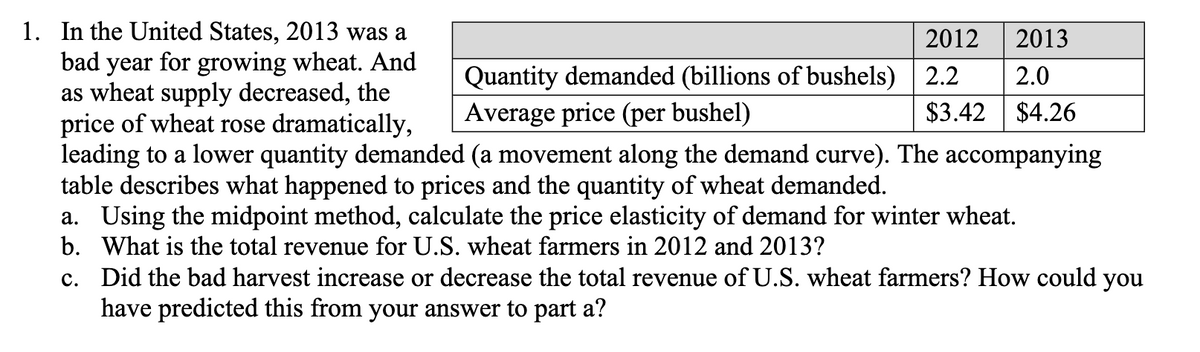
Transcribed Image Text:1. In the United States, 2013 was a
bad year for growing wheat. And
as wheat supply decreased, the
price of wheat rose dramatically,
leading to a lower quantity demanded (a movement along the demand curve). The accompanying
table describes what happened to prices and the quantity of wheat demanded.
a. Using the midpoint method, calculate the price elasticity of demand for winter wheat.
b. What is the total revenue for U.S. wheat farmers in 2012 and 2013?
c. Did the bad harvest increase or decrease the total revenue of U.S. wheat farmers? How could you
have predicted this from your answer to part a?
2012
2013
Quantity demanded (billions of bushels) 2.2
Average price (per bushel)
2.0
$3.42
$4.26
Expert Solution
This question has been solved!
Explore an expertly crafted, step-by-step solution for a thorough understanding of key concepts.

This is a popular solution!

Trending now
This is a popular solution!

Step by step
Solved in 2 steps

Knowledge Booster


Learn more about
Need a deep-dive on the concept behind this application? Look no further. Learn more about this topic, economics and related others by exploring similar questions and additional content below.Recommended textbooks for you
Principles of Microeconomics (MindTap Course List)
Economics
ISBN:
9781305971493
Author:
N. Gregory Mankiw
Publisher:
Cengage Learning

Essentials of Economics (MindTap Course List)
Economics
ISBN:
9781337091992
Author:
N. Gregory Mankiw
Publisher:
Cengage Learning

Principles of Economics (MindTap Course List)
Economics
ISBN:
9781305585126
Author:
N. Gregory Mankiw
Publisher:
Cengage Learning
Principles of Microeconomics (MindTap Course List)
Economics
ISBN:
9781305971493
Author:
N. Gregory Mankiw
Publisher:
Cengage Learning
Essentials of Economics (MindTap Course List)
Economics
ISBN:
9781337091992
Author:
N. Gregory Mankiw
Publisher:
Cengage Learning
Principles of Economics (MindTap Course List)
Economics
ISBN:
9781305585126
Author:
N. Gregory Mankiw
Publisher:
Cengage Learning

Principles of Economics 2e
Economics
ISBN:
9781947172364
Author:
Steven A. Greenlaw; David Shapiro
Publisher:
OpenStax

Principles of Microeconomics
Economics
ISBN:
9781305156050
Author:
N. Gregory Mankiw
Publisher:
Cengage Learning