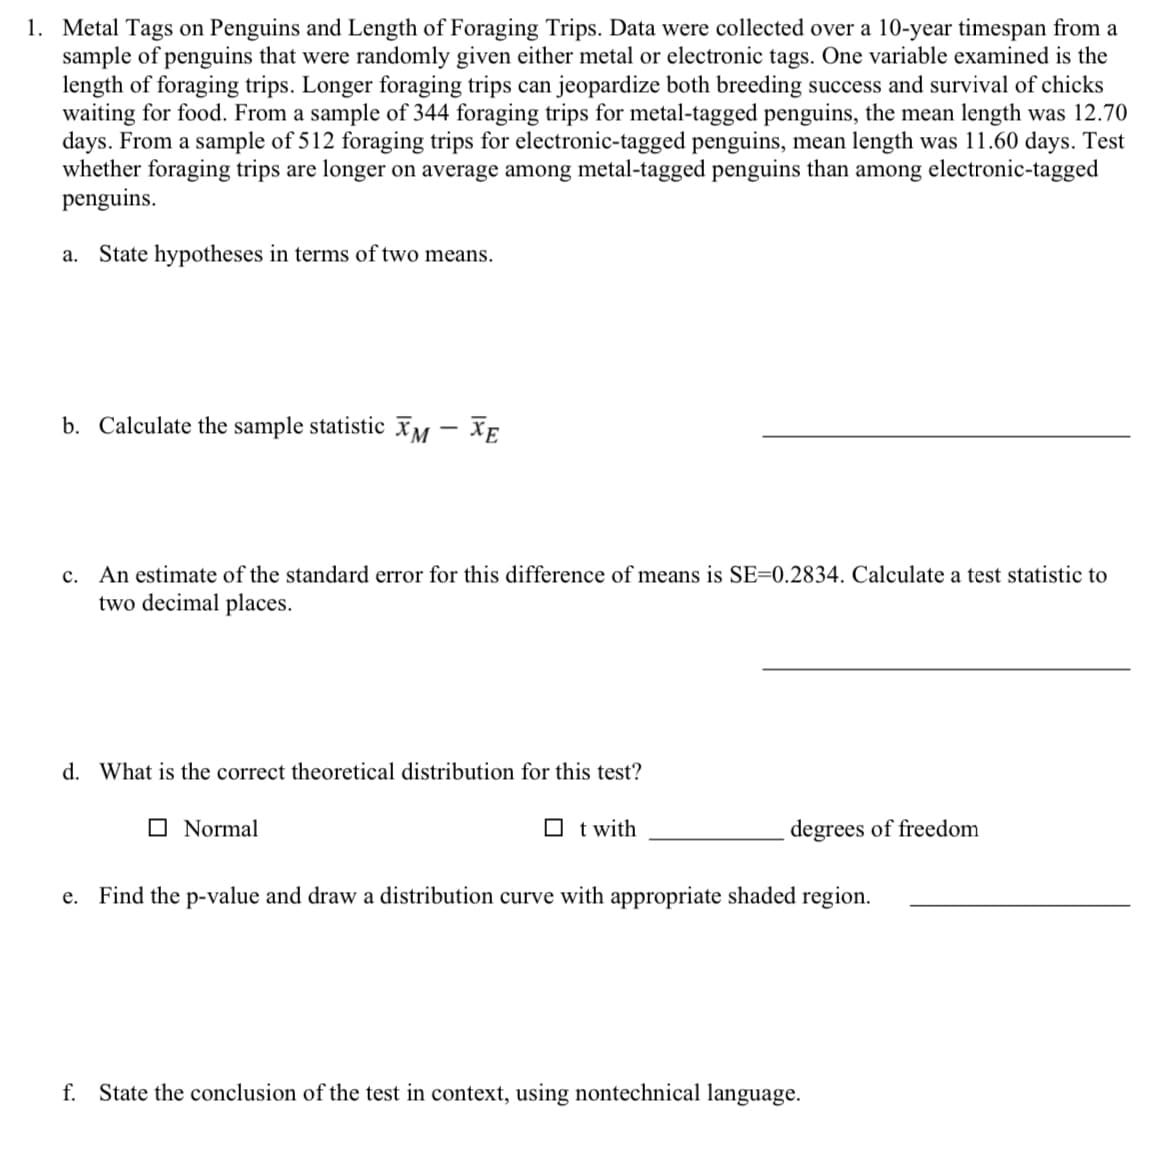
1. Metal Tags on Penguins and Length of Foraging Trips. Data were collected over a 10-year timespan from a sample of penguins that were randomly given either metal or electronic tags. One variable examined is the length of foraging trips. Longer foraging trips can jeopardize both breeding success and survival of chicks waiting for food. From a sample of 344 foraging trips for metal-tagged penguins, the mean length was 12.70 days. From a sample of 512 foraging trips for electronic-tagged penguins, mean length was 11.60 days. Test whether foraging trips are longer on average among metal-tagged penguins than among electronic-tagged penguins. a. State hypotheses in terms of two means. b. Calculate the sample statistic XM - XE c. An estimate of the standard error for this difference of means is SE-0.2834. Calculate a test statistic to two decimal places. d. What is the correct theoretical distribution for this test? Normal t with degrees of freedom e. Find the p-value and draw a distribution curve with appropriate shaded region. f. State the conclusion of the test in context, using nontechnical language.
1. Metal Tags on Penguins and Length of Foraging Trips. Data were collected over a 10-year timespan from a sample of penguins that were randomly given either metal or electronic tags. One variable examined is the length of foraging trips. Longer foraging trips can jeopardize both breeding success and survival of chicks waiting for food. From a sample of 344 foraging trips for metal-tagged penguins, the mean length was 12.70 days. From a sample of 512 foraging trips for electronic-tagged penguins, mean length was 11.60 days. Test whether foraging trips are longer on average among metal-tagged penguins than among electronic-tagged penguins. a. State hypotheses in terms of two means. b. Calculate the sample statistic XM - XE c. An estimate of the standard error for this difference of means is SE-0.2834. Calculate a test statistic to two decimal places. d. What is the correct theoretical distribution for this test? Normal t with degrees of freedom e. Find the p-value and draw a distribution curve with appropriate shaded region. f. State the conclusion of the test in context, using nontechnical language.
Glencoe Algebra 1, Student Edition, 9780079039897, 0079039898, 2018
18th Edition
ISBN:9780079039897
Author:Carter
Publisher:Carter
Chapter4: Equations Of Linear Functions
Section: Chapter Questions
Problem 8SGR
Related questions
Question

Transcribed Image Text:1. Metal Tags on Penguins and Length of Foraging Trips. Data were collected over a 10-year timespan from a
sample of penguins that were randomly given either metal or electronic tags. One variable examined is the
length of foraging trips. Longer foraging trips can jeopardize both breeding success and survival of chicks
waiting for food. From a sample of 344 foraging trips for metal-tagged penguins, the mean length was 12.70
days. From a sample of 512 foraging trips for electronic-tagged penguins, mean length was 11.60 days. Test
whether foraging trips are longer on average among metal-tagged penguins than among electronic-tagged
penguins.
a. State hypotheses in terms of two means.
b. Calculate the sample statistic XM - XE
c. An estimate of the standard error for this difference of means is SE-0.2834. Calculate a test statistic to
two decimal places.
d. What is the correct theoretical distribution for this test?
☐Normal
☐t with
degrees of freedom
e. Find the p-value and draw a distribution curve with appropriate shaded region.
f. State the conclusion of the test in context, using nontechnical language.
Expert Solution
This question has been solved!
Explore an expertly crafted, step-by-step solution for a thorough understanding of key concepts.
This is a popular solution!
Trending now
This is a popular solution!
Step by step
Solved in 6 steps with 30 images

Recommended textbooks for you

Glencoe Algebra 1, Student Edition, 9780079039897…
Algebra
ISBN:
9780079039897
Author:
Carter
Publisher:
McGraw Hill

Glencoe Algebra 1, Student Edition, 9780079039897…
Algebra
ISBN:
9780079039897
Author:
Carter
Publisher:
McGraw Hill