1. On any given day in Minnesota, there are an average of 205 car accidents. From a sample of 7 car accidents, the likelihood of survival (in percentage) and the speed of the car during the crash and is given below. Car Speed (mph) 40 58 95 30 61 67 84 Likelihood of Survival 89.5 (percentage) 50.5 39 38 52 95 44 a) Create a scatterplot of this data by hand. What initial relationship do you see? b) Find the correlation coefficient between these variables. Interpret this value. c.) Determine if the correlation between the speed of a car during an accident and the likelihood of survival is significant. Use a significance level of 0.025, and the p-value method. d) Find the linear regression equation where the likelihood of survival (Y) is the dependent response variable, and the speedof the car (X) is the independent variable. Interpret the slope and the intercept. e) Predict the likelihood of survival if during accident, the car was traveling at 75 miles per hour.
1. On any given day in Minnesota, there are an average of 205 car accidents. From a sample of 7 car accidents, the likelihood of survival (in percentage) and the speed of the car during the crash and is given below. Car Speed (mph) 40 58 95 30 61 67 84 Likelihood of Survival 89.5 (percentage) 50.5 39 38 52 95 44 a) Create a scatterplot of this data by hand. What initial relationship do you see? b) Find the correlation coefficient between these variables. Interpret this value. c.) Determine if the correlation between the speed of a car during an accident and the likelihood of survival is significant. Use a significance level of 0.025, and the p-value method. d) Find the linear regression equation where the likelihood of survival (Y) is the dependent response variable, and the speedof the car (X) is the independent variable. Interpret the slope and the intercept. e) Predict the likelihood of survival if during accident, the car was traveling at 75 miles per hour.

Glencoe Algebra 1, Student Edition, 9780079039897, 0079039898, 2018
18th Edition
ISBN:9780079039897
Author:Carter
Publisher:Carter
Chapter10: Statistics
Section10.4: Distributions Of Data
Problem 19PFA

Related questions
Question
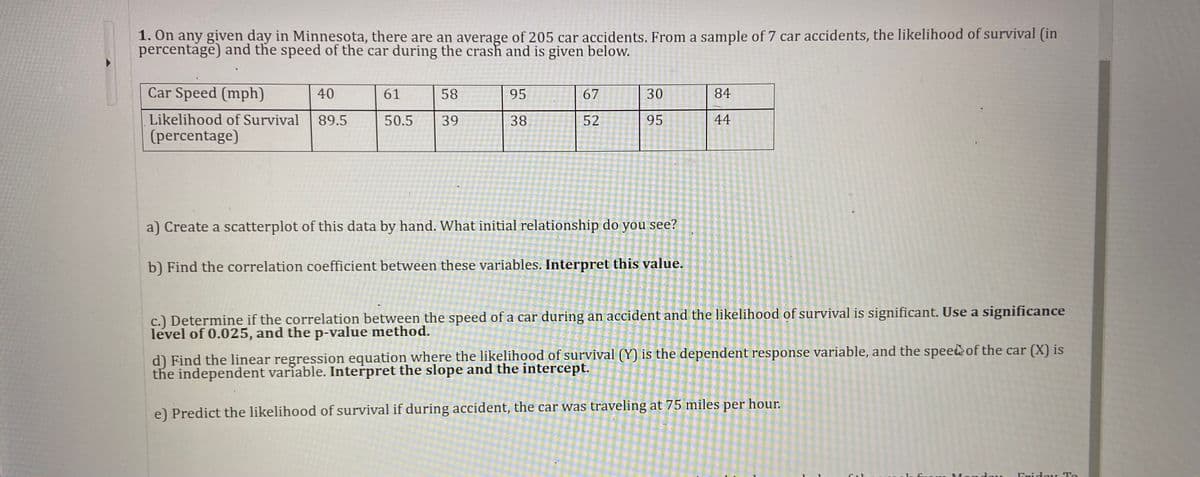
Transcribed Image Text:1. On any given day in Minnesota, there are an average of 205 car accidents. From a sample of 7 car accidents, the likelihood of survival (in
percentage) and the speed of the car during the crash and is given below.
Car Speed (mph)
40
61
58
95
67
84
Likelihood of Survival
89.5
50.5
39
38.
52
95
44
(percentage)
a) Create a scatterplot of this data by hand. What initial relationship do you see?
b) Find the correlation coefficient between these variables. Interpret this value.
c.) Determine if the correlation between the speed of a car during an accident and the likelihood of survival is significant. Use a significance
level of 0.025, and the p-value method.
d) Find the linear regression equation where the likelihood of survival (Y) is the dependent response variable, and the spee& of the car (X) is
the independent variable. Interpret the slope and the intercept.
e) Predict the likelihood of survival if during accident, the car was traveling at 75 miles per hour.
Eridou To
30
Expert Solution
This question has been solved!
Explore an expertly crafted, step-by-step solution for a thorough understanding of key concepts.

This is a popular solution!

Trending now
This is a popular solution!

Step by step
Solved in 3 steps with 3 images

Recommended textbooks for you
Glencoe Algebra 1, Student Edition, 9780079039897…
Algebra
ISBN:
9780079039897
Author:
Carter
Publisher:
McGraw Hill
Glencoe Algebra 1, Student Edition, 9780079039897…
Algebra
ISBN:
9780079039897
Author:
Carter
Publisher:
McGraw Hill