1. Submit MATLAB programs and their plots of the following sequences over the indicated interval. (a) x(n) = 28(n + 2)-8(n-4), -5 ≤ n ≤ 5. 0 ≤n ≤ 20. (b) x(n) = n[u(n)-u(n-10)] 2. It is useful to plot the continuous time signal on the same plot. All signals in MATLAB are discrete-time, but they will look like continuous-time signals if the sampling rate is much higher than the Nyquist rate. Please fill in the "Problem to solve" region below to show the Nyquist rate. Submit the final code and its graph.

Database System Concepts
7th Edition
ISBN:9780078022159
Author:Abraham Silberschatz Professor, Henry F. Korth, S. Sudarshan
Publisher:Abraham Silberschatz Professor, Henry F. Korth, S. Sudarshan
Chapter1: Introduction
Section: Chapter Questions
Problem 1PE
icon
Related questions
Question

Need help with the question being ask for this MATLAB practice. Using version R2021b. 

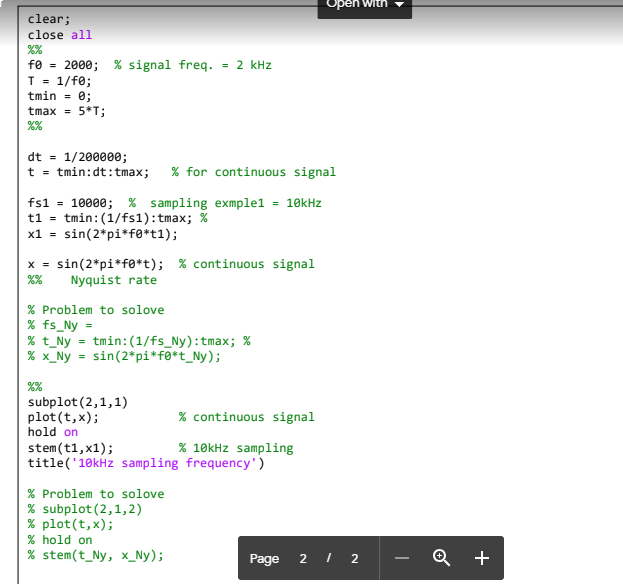
Question/request is in the image for the following code. 

clear;
close all
%%
f0 = 2000; % signal freq. = 2 kHz
T = 1/f0;
tmin = 0;
tmax = 5*T;
%%
dt = 1/200000;
t = tmin:dt:tmax; % for continuous signal
fs1 = 10000; % sampling exmple1 = 10kHz
t1 = tmin:(1/fs1):tmax; %
x1 = sin(2*pi*f0*t1);
x = sin(2*pi*f0*t); % continuous signal
%% Nyquist rate
% Problem to solove
% fs_Ny =
% t_Ny = tmin:(1/fs_Ny):tmax; %
% x_Ny = sin(2*pi*f0*t_Ny);
%%
subplot(2,1,1)
plot(t,x); % continuous signal
hold on
stem(t1,x1); % 10kHz sampling
title('10kHz sampling frequency')
% Problem to solove
% subplot(2,1,2)
% plot(t,x);
% hold on
% stem(t_Ny, x_Ny);

clear;
close all
fe = 2000; % signal freq. 2 kHz
T = 1/f0;
tmin = 0;
tmax = 5*T;
%%
%670
dt = 1/200000;
t = tmin:dt: tmax; % for continuous signal
fs1 = 10000; % sampling exmple1 = 10kHz
t1 = tmin: (1/fs1): tmax; %
x1 = sin(2*pi*f*t1);
X = sin(2*pi*fø*t); % continuous signal
%% Nyquist rate
% Problem to solove
% fs_Ny =
% t_Ny = tmin: (1/fs_Ny): tmax; %
% x _Ny = sin(2*pi*f*t_Ny);
%%
subplot (2,1,1)
plot (t, x);
hold on
% continuous signal
% 10kHz sampling
stem (t1, x1);
title('10kHz sampling frequency')
% Problem to solove
% subplot (2,1,2)
% plot(t, x);
% hold on
% stem (t_Ny, x_Ny);
Open with
Page 2 / 2
Q +
Transcribed Image Text:clear; close all fe = 2000; % signal freq. 2 kHz T = 1/f0; tmin = 0; tmax = 5*T; %% %670 dt = 1/200000; t = tmin:dt: tmax; % for continuous signal fs1 = 10000; % sampling exmple1 = 10kHz t1 = tmin: (1/fs1): tmax; % x1 = sin(2*pi*f*t1); X = sin(2*pi*fø*t); % continuous signal %% Nyquist rate % Problem to solove % fs_Ny = % t_Ny = tmin: (1/fs_Ny): tmax; % % x _Ny = sin(2*pi*f*t_Ny); %% subplot (2,1,1) plot (t, x); hold on % continuous signal % 10kHz sampling stem (t1, x1); title('10kHz sampling frequency') % Problem to solove % subplot (2,1,2) % plot(t, x); % hold on % stem (t_Ny, x_Ny); Open with Page 2 / 2 Q +
1. Submit MATLAB programs and their plots of the following sequences over the indicated interval.
(a)
x(n) = 28(n+2) -8(n-4), -5≤n ≤ 5.
x(n) = n[u(n)-u(n-10)] 0 ≤ n ≤ 20.
(b)
2. It is useful to plot the continuous time signal on the same plot. All signals in MATLAB are discrete-time, but they will
look like continuous-time signals if the sampling rate is much higher than the Nyquist rate. Please fill in the "Problem to
solve" region below to show the Nyquist rate. Submit the final code and its graph.
Transcribed Image Text:1. Submit MATLAB programs and their plots of the following sequences over the indicated interval. (a) x(n) = 28(n+2) -8(n-4), -5≤n ≤ 5. x(n) = n[u(n)-u(n-10)] 0 ≤ n ≤ 20. (b) 2. It is useful to plot the continuous time signal on the same plot. All signals in MATLAB are discrete-time, but they will look like continuous-time signals if the sampling rate is much higher than the Nyquist rate. Please fill in the "Problem to solve" region below to show the Nyquist rate. Submit the final code and its graph.
Expert Solution
trending now

Trending now

This is a popular solution!

steps

Step by step

Solved in 3 steps with 3 images

Blurred answer
Knowledge Booster
Fundamentals of Boolean Algebra and Digital Logics
Learn more about
Need a deep-dive on the concept behind this application? Look no further. Learn more about this topic, computer-science and related others by exploring similar questions and additional content below.
Similar questions
  • SEE MORE QUESTIONS
Recommended textbooks for you
Database System Concepts
Computer Science
ISBN:
9780078022159
Author:
Abraham Silberschatz Professor, Henry F. Korth, S. Sudarshan
Publisher:
McGraw-Hill Education
Starting Out with Python (4th Edition)
Computer Science
ISBN:
9780134444321
Author:
Tony Gaddis
Publisher:
PEARSON
Digital Fundamentals (11th Edition)
Computer Science
ISBN:
9780132737968
Author:
Thomas L. Floyd
Publisher:
PEARSON
C How to Program (8th Edition)
Computer Science
ISBN:
9780133976892
Author:
Paul J. Deitel, Harvey Deitel
Publisher:
PEARSON
Database Systems: Design, Implementation, & Manag…
Computer Science
ISBN:
9781337627900
Author:
Carlos Coronel, Steven Morris
Publisher:
Cengage Learning
Programmable Logic Controllers
Computer Science
ISBN:
9780073373843
Author:
Frank D. Petruzella
Publisher:
McGraw-Hill Education