1. Suppose in a particular college, 60% of the student population is female. (a) Calculate the probability that a class of 10 students will have exactly four females. (b) Calculate the probability that a class of 10 students will contain five, six, or seven females. (c) Calculate the probability that at least five students in a class of 10 will be female.
1. Suppose in a particular college, 60% of the student population is female. (a) Calculate the probability that a class of 10 students will have exactly four females. (b) Calculate the probability that a class of 10 students will contain five, six, or seven females. (c) Calculate the probability that at least five students in a class of 10 will be female.

Holt Mcdougal Larson Pre-algebra: Student Edition 2012
1st Edition
ISBN:9780547587776
Author:HOLT MCDOUGAL
Publisher:HOLT MCDOUGAL
Chapter11: Data Analysis And Probability
Section11.8: Probabilities Of Disjoint And Overlapping Events
Problem 2C

Related questions

Concept explainers
Contingency Table
A contingency table can be defined as the visual representation of the relationship between two or more categorical variables that can be evaluated and registered. It is a categorical version of the scatterplot, which is used to investigate the linear relationship between two variables. A contingency table is indeed a type of frequency distribution table that displays two variables at the same time.
Binomial Distribution
Binomial is an algebraic expression of the sum or the difference of two terms. Before knowing about binomial distribution, we must know about the binomial theorem.
Topic Video
Question
1. Suppose in a particular college, 60% of the student population is female.
(a) Calculate the probability that a class of 10 students will have exactly four females.
(b) Calculate the probability that a class of 10 students will contain five, six, or seven
females.
(c) Calculate the probability that at least five students in a class of 10 will be female.
2. Suppose the Road Transport and Safety Agency (RTSA) officers have mounted a check point and they observe the speed at which the cars pass through that check point. Assume the speeds are normally distributed such that μ = 61 km per hour and σ = 4 km per hour.
(a) Calculate the probability that the next car that passes through the checkpoint will be travelling slower than 65 km per hour.
(b) Calculate the probability that the next car passing will be travelling more than 66 km per hour.
3. Suppose a certain study conducted in 2000 reported 71.3% of men between the ages of 45 and 54 are considered overweight. If a random sample of 150 men in this age group is selected, what is the probability that between 66% and 75% of them are overweight?
4. The data set below shows the amount of trash generated by ten households (in pounds per day). Assume that the population is normally distributed.
3.9 4.6 15.6 10.5 16.0 6.7 12.0 9.2 13.8 16.8
(a) Construct a 95% confidence interval for the mean based on the sample. (b) Construct a 90% confidence interval for the mean.
(c) Construct an 80% confidence interval for the mean.
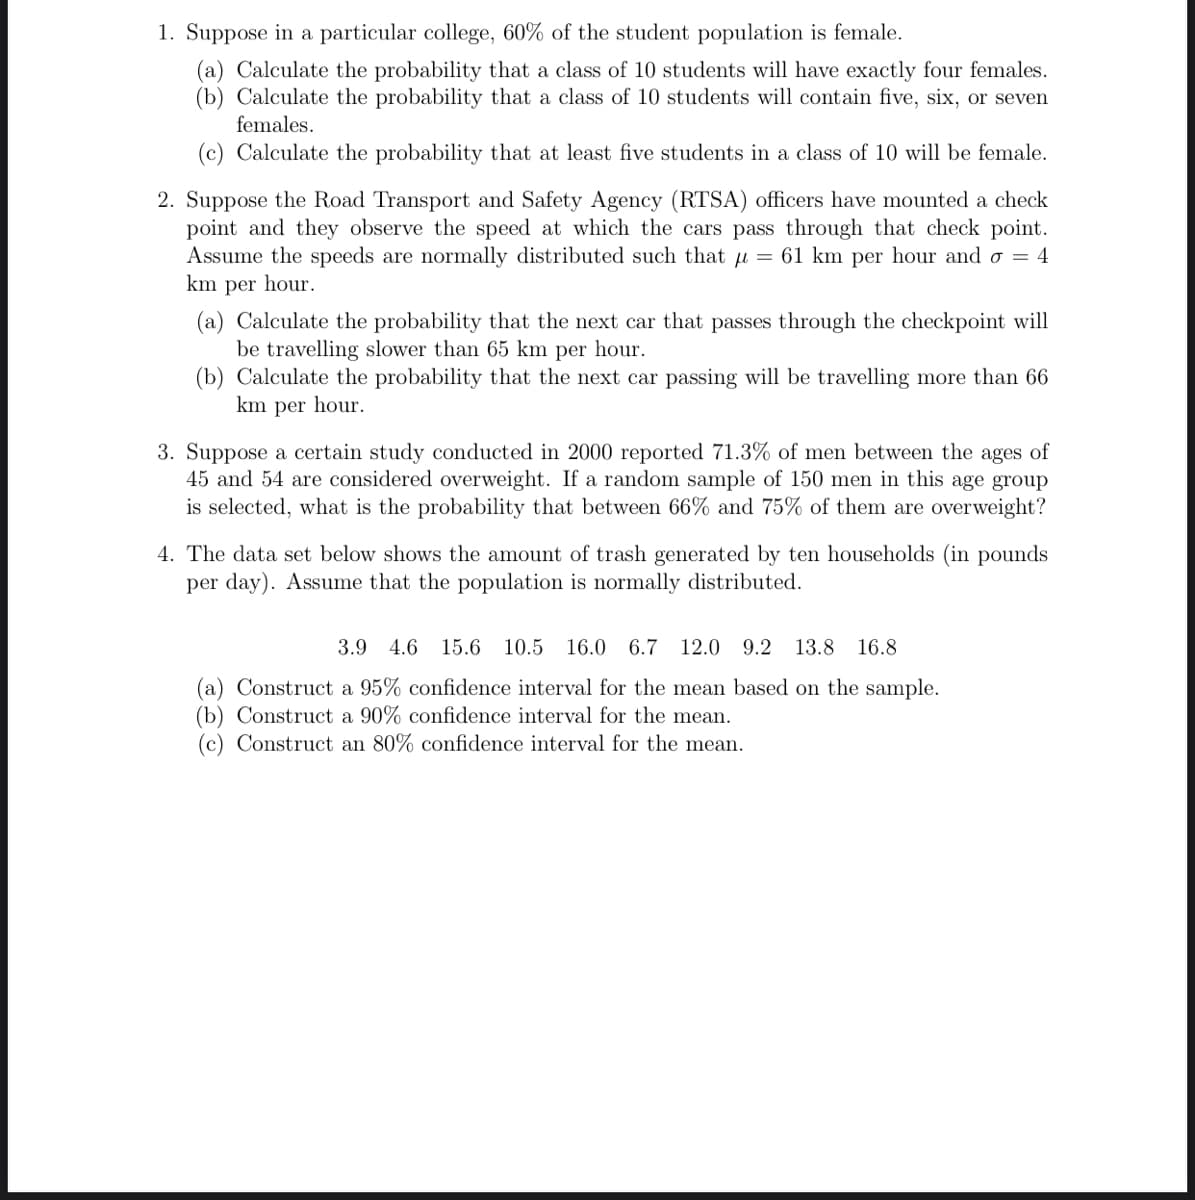
Transcribed Image Text:1. Suppose in a particular college, 60% of the student population is female.
(a) Calculate the probability that a class of 10 students will have exactly four females.
(b) Calculate the probability that a class of 10 students will contain five, six, or seven
females.
(c) Calculate the probability that at least five students in a class of 10 will be female.
2. Suppose the Road Transport and Safety Agency (RTSA) officers have mounted a check
point and they observe the speed at which the cars pass through that check point.
Assume the speeds are normally distributed such that u = 61 km per hour and o = 4
km per hour.
(a) Calculate the probability that the next car that passes through the checkpoint will
be travelling slower than 65 km per hour.
(b) Calculate the probability that the next car passing will be travelling more than 66
km per hour.
3. Suppose a certain study conducted in 2000 reported 71.3% of men between the ages of
45 and 54 are considered overweight. If a random sample of 150 men in this age group
is selected, what is the probability that between 66% and 75% of them are overweight?
4. The data set below shows the amount of trash generated by ten households (in pounds
per day). Assume that the population is normally distributed.
3.9
4.6
15.6
10.5
16.0 6.7
12.0
9.2 13.8
16.8
(a) Construct a 95% confidence interval for the mean based on the sample.
(b) Construct a 90% confidence interval for the mean.
(c) Construct an 80% confidence interval for the mean.
Expert Solution
This question has been solved!
Explore an expertly crafted, step-by-step solution for a thorough understanding of key concepts.

This is a popular solution!

Trending now
This is a popular solution!

Step by step
Solved in 4 steps

Knowledge Booster


Learn more about
Need a deep-dive on the concept behind this application? Look no further. Learn more about this topic, statistics and related others by exploring similar questions and additional content below.Recommended textbooks for you
Holt Mcdougal Larson Pre-algebra: Student Edition…
Algebra
ISBN:
9780547587776
Author:
HOLT MCDOUGAL
Publisher:
HOLT MCDOUGAL


Algebra and Trigonometry (MindTap Course List)
Algebra
ISBN:
9781305071742
Author:
James Stewart, Lothar Redlin, Saleem Watson
Publisher:
Cengage Learning
Holt Mcdougal Larson Pre-algebra: Student Edition…
Algebra
ISBN:
9780547587776
Author:
HOLT MCDOUGAL
Publisher:
HOLT MCDOUGAL
Algebra and Trigonometry (MindTap Course List)
Algebra
ISBN:
9781305071742
Author:
James Stewart, Lothar Redlin, Saleem Watson
Publisher:
Cengage Learning