1. Suppose that you usually consume some ice creams monthly. The quantity demanded (In economics, the quantity demanded of a goods or service is the total amount that buyers are willing to and able to purchase.) is closed related to many factors. Please list some of them you can think of and explain how they affect the quantity demanded. 2. One of the most important factors is the price of the goods or service. The following table, called the demand schedule, describes how the number of ice creams you may consume each month depends on the price of it. Please complete the following table. The price of ice-cream in dollar (P) The quantity demanded of ice cream (Q) 0.00 19 0.50 16 1.00 13 1.50 ? 2.00 2.50 3.00 For example, when the price of the ice cream is $0.00, you will consume 19 ice creams in one month. While the price is $0.50, you will consume 16 ice creams. Find the pattern of quantity and try to explain. 3. Use x-axis to represent the quantity demanded, and y-axis to represent the price of ice cream. From the table above, draw the graph about the price (P) and the quantity demanded (Q) and find the equation the line. In Economics, the curve is called the demand curve.
1. Suppose that you usually consume some ice creams monthly. The quantity demanded (In economics, the quantity demanded of a goods or service is the total amount that buyers are willing to and able to purchase.) is closed related to many factors. Please list some of them you can think of and explain how they affect the quantity demanded. 2. One of the most important factors is the price of the goods or service. The following table, called the demand schedule, describes how the number of ice creams you may consume each month depends on the price of it. Please complete the following table. The price of ice-cream in dollar (P) The quantity demanded of ice cream (Q) 0.00 19 0.50 16 1.00 13 1.50 ? 2.00 2.50 3.00 For example, when the price of the ice cream is $0.00, you will consume 19 ice creams in one month. While the price is $0.50, you will consume 16 ice creams. Find the pattern of quantity and try to explain. 3. Use x-axis to represent the quantity demanded, and y-axis to represent the price of ice cream. From the table above, draw the graph about the price (P) and the quantity demanded (Q) and find the equation the line. In Economics, the curve is called the demand curve.

College Algebra (MindTap Course List)
12th Edition
ISBN:9781305652231
Author:R. David Gustafson, Jeff Hughes
Publisher:R. David Gustafson, Jeff Hughes
Chapter6: Linear Systems
Section6.8: Linear Programming
Problem 3SC: In Example 3, if the accountant earns a profit of 100 on each individual return and a profit of 175...

Related questions
Question
100%
Transcribed Image Text:quations.
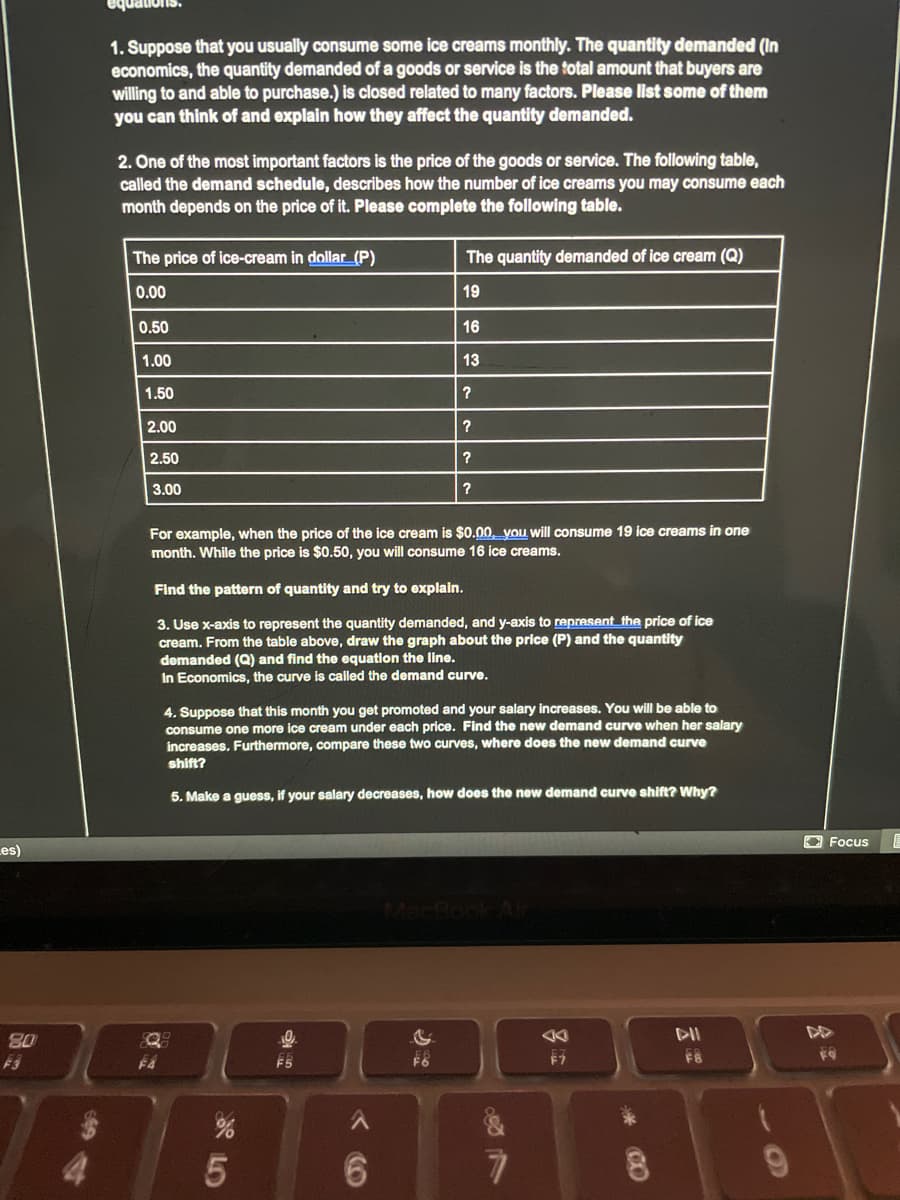
1. Suppose that you usually consume some ice creams monthly. The quantity demanded (In
economics, the quantity demanded of a goods or service is the total amount that buyers are
willing to and able to purchase.) is closed related to many factors. Please list some of them
you can think of and explain how they affect the quantity demanded.
2. One of the most important factors is the price of the goods or service. The following table,
called the demand schedule, describes how the number of ice creams you may consume each
month depends on the price of it. Please complete the following table.
The price of ice-cream in dollar_(P)
The quantity demanded of ice cream (Q)
0.00
19
0.50
16
1.00
13
1.50
2.00
2.50
3.00
For example, when the price of the ice cream is $0.00, you will consume 19 ice creams in one
month. While the price is $0.50, you will consume 16 ice creams.
Find the pattern of quantity and try to explain.
3. Use x-axis to represent the quantity demanded, and y-axis to represent the price of ice
cream. From the table above, draw the graph about the price (P) and the quantity
demanded (Q) and find the equation the line.
In Economics, the curve is called the demand curve.
4. Suppose that this month you get promoted and your salary increases. You will be able to
consume one more ice cream under each price. Find the new demand curve when her salary
increases, Furthermore, compare these two curves, where does the new demand curve
shift?
5. Make a guess, if your salary decreases, how does the new demand curve shift? Why?
O Focus
Les)
Mac
80
F5
F6
6.
6.
云
CO
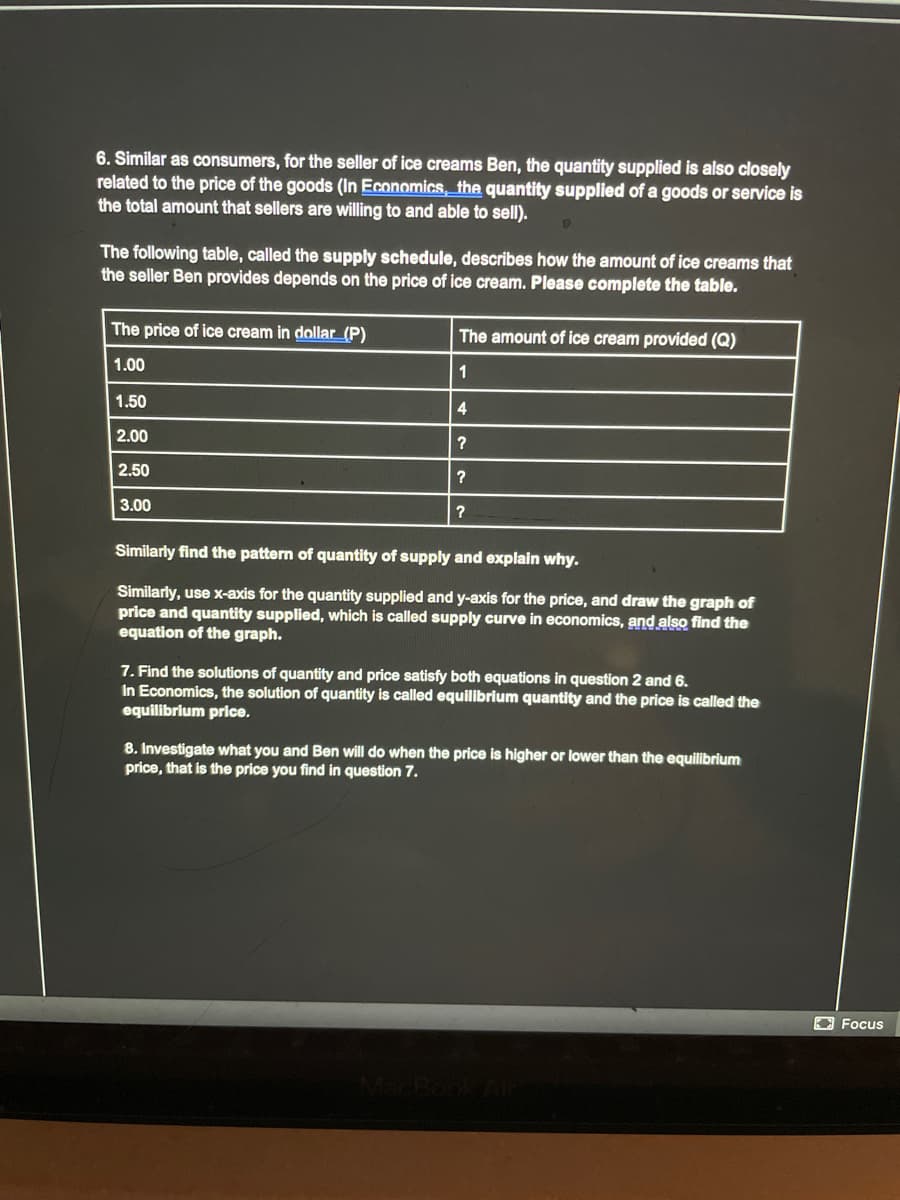
Transcribed Image Text:6. Similar as consumers, for the seller of ice creams Ben, the quantity supplied is also closely
related to the price of the goods (In Economics, the quantity supplied of a goods or service is
the total amount that sellers are willing to and able to sell).
The following table, called the supply schedule, describes how the amount of ice creams that
the seller Ben provides depends on the price of ice cream. Please complete the table.
The price of ice cream in dollar (P)
The amount of ice cream provided (Q)
1.00
1.50
4
2.00
2.50
3.00
?
Similarly find the pattern of quantity of supply and explain why.
Similarly, use x-axis for the quantity supplied and y-axis for the price, and draw the graph of
price and quantity supplied, which is called supply curve in economics, and also find the
equation of the graph.
7. Find the solutions of quantity and price satisfy both equations in question 2 and 6.
In Economics, the solution of quantity is called equilibrium quantity and the price is called the
equilibrium price.
8. Investigate what you and Ben will do when the price is higher or lower than the equilibrium
price, that is the price you find in question 7.
O Focus
Expert Solution
This question has been solved!
Explore an expertly crafted, step-by-step solution for a thorough understanding of key concepts.

This is a popular solution!

Trending now
This is a popular solution!

Step by step
Solved in 2 steps with 2 images

Recommended textbooks for you
College Algebra (MindTap Course List)
Algebra
ISBN:
9781305652231
Author:
R. David Gustafson, Jeff Hughes
Publisher:
Cengage Learning


Algebra & Trigonometry with Analytic Geometry
Algebra
ISBN:
9781133382119
Author:
Swokowski
Publisher:
Cengage
College Algebra (MindTap Course List)
Algebra
ISBN:
9781305652231
Author:
R. David Gustafson, Jeff Hughes
Publisher:
Cengage Learning
Algebra & Trigonometry with Analytic Geometry
Algebra
ISBN:
9781133382119
Author:
Swokowski
Publisher:
Cengage