1. Suppose the following image shows the supply and demand graph for screwdrivers. The government enacts a price ceiling on screwdrivers at $8. What effect does the price ceiling have on the following: a. The quantity of screwdrivers demanded by consumers? b. The quantity of screwdrivers supplied by producers? How do these quantities relate to the equilibrium price and quantity prior to the enactment of the price ceiling? Why? C. 12 Price 10+ Supply 8. 6+ 4+ Demand 60 120 180 160 Quantity
1. Suppose the following image shows the supply and demand graph for screwdrivers. The government enacts a price ceiling on screwdrivers at $8. What effect does the price ceiling have on the following: a. The quantity of screwdrivers demanded by consumers? b. The quantity of screwdrivers supplied by producers? How do these quantities relate to the equilibrium price and quantity prior to the enactment of the price ceiling? Why? C. 12 Price 10+ Supply 8. 6+ 4+ Demand 60 120 180 160 Quantity

Essentials of Economics (MindTap Course List)
8th Edition
ISBN:9781337091992
Author:N. Gregory Mankiw
Publisher:N. Gregory Mankiw
Chapter6: Supply, Demand And Government Policies
Section: Chapter Questions
Problem 2PA

Related questions
Question
Transcribed Image Text:Chapter 5: Price Controls
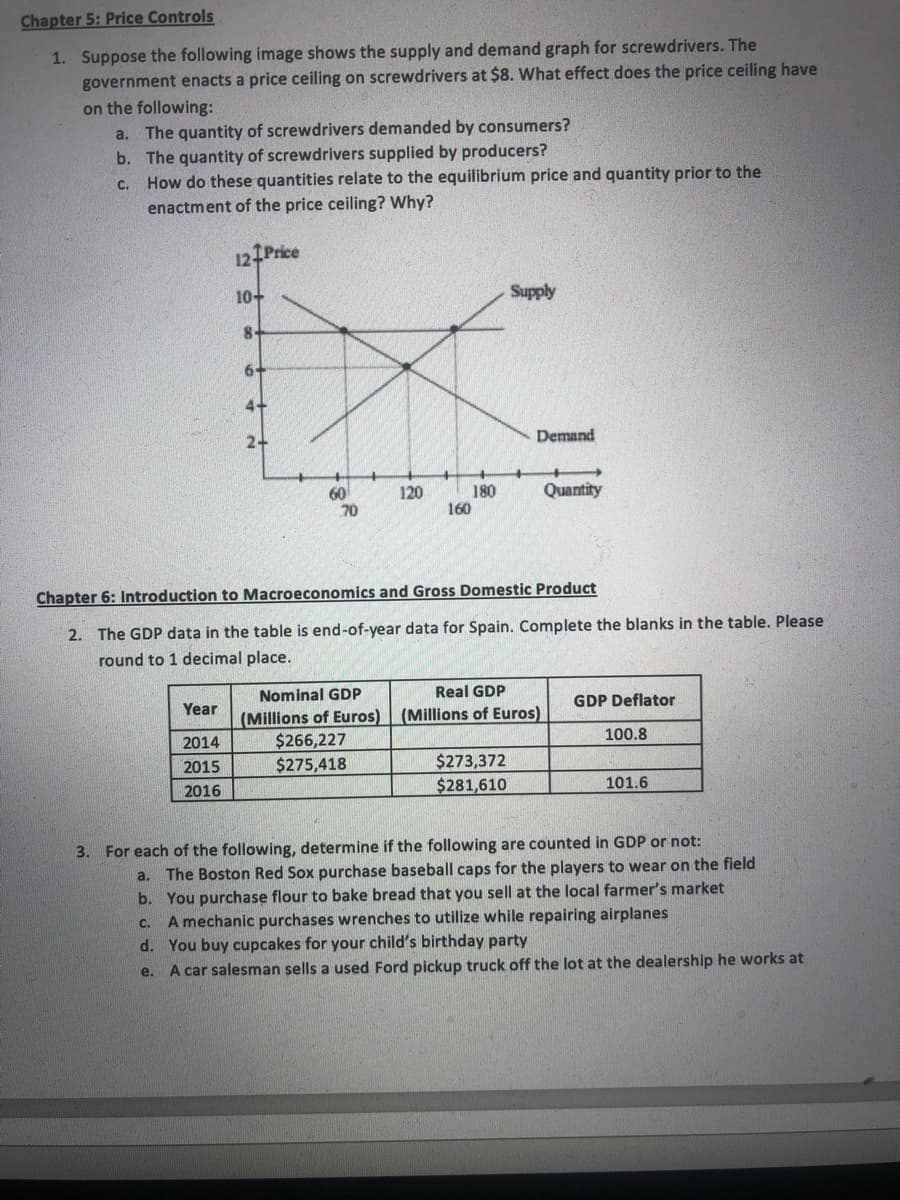
1. Suppose the following image shows the supply and demand graph for screwdrivers. The
government enacts a price ceiling on screwdrivers at $8. What effect does the price ceiling have
on the following:
The quantity of screwdrivers demanded by consumers?
b. The quantity of screwdrivers supplied by producers?
c. How do these quantities relate to the equilibrium price and quantity prior to the
a.
enactment of the price ceiling? Why?
12 Price
10+
Supply
8-
6-
4+
2-
Demand
60
70
180
160
120
Quantity
Chapter 6: Introduction to Macroeconomics and Gross Domestic Product
2. The GDP data in the table is end-of-year data for Spain. Complete the blanks in the table. Please
round to 1 decimal place.
Nominal GDP
Real GDP
Year
GDP Deflator
(Millions of Euros) (Millions of Euros)
$266,227
$275,418
2014
100.8
2015
$273,372
2016
$281,610
101.6
3. For each of the following, determine if the following are counted in GDP or not:
a. The Boston Red Sox purchase baseball caps for the players to wear on the field
b. You purchase flour to bake bread that you sell at the local farmer's market
c. A mechanic purchases wrenches to utilize while repairing airplanes
d. You buy cupcakes for your child's birthday party
A car salesman sells a used Ford pickup truck off the lot at the dealership he works at
e.
Transcribed Image Text:ments, choose Check for Updates.
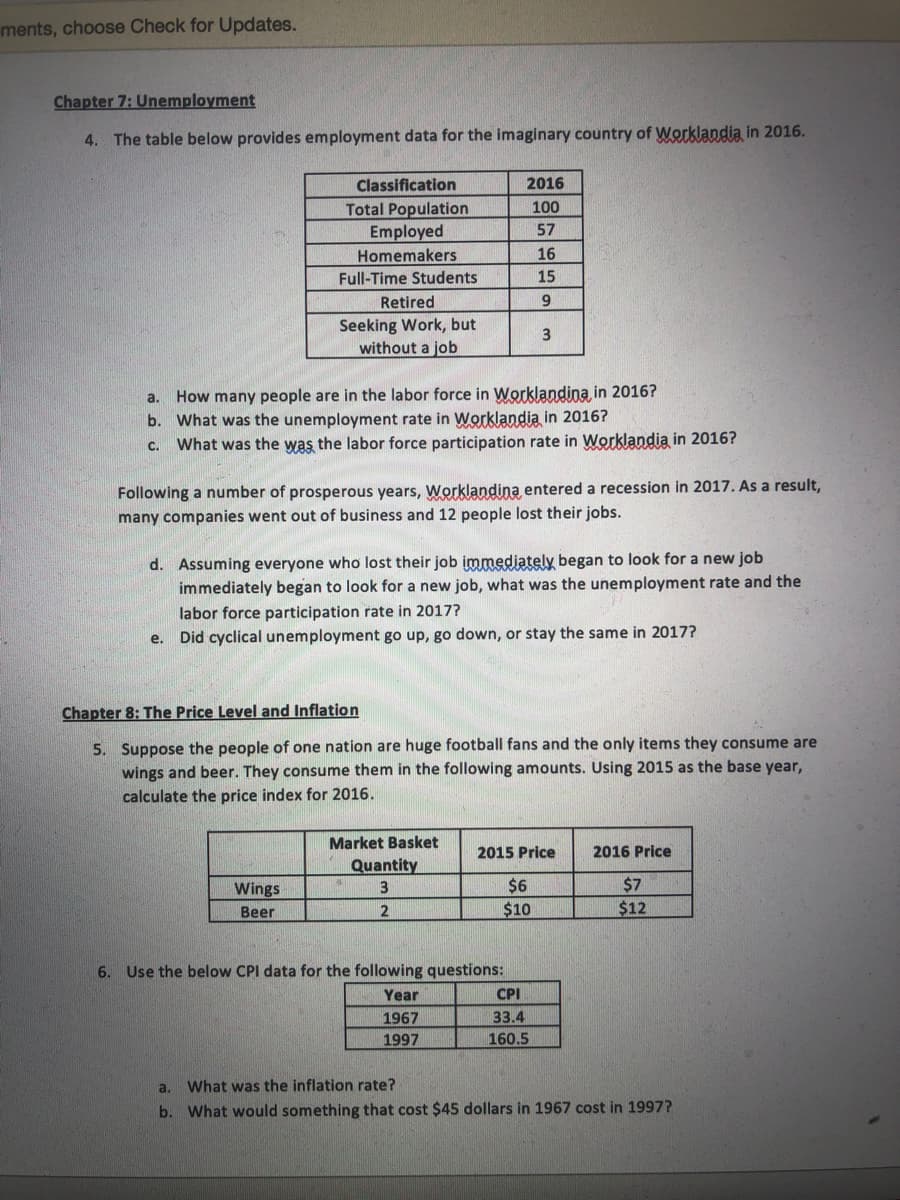
Chapter 7: Unemployment
4. The table below provides employment data for the imaginary country of Worklandia in 2016.
Classification
2016
100
Total Population
Employed
Homemakers
57
16
Full-Time Students
15
Retired
Seeking Work, but
without a job
a. How many people are in the labor force in Worklandina in 2016?
b. What was the unemployment rate in Worklandia in 2016?
c. What was the was the labor force participation rate in Worklandia in 2016?
Following a number of prosperous years, Worklandina entered a recession in 2017. As a result,
many companies went out of business and 12 people lost their jobs.
d. Assuming everyone who lost their job immediately began to look for a new job
immediately began to look for a new job, what was the unemployment rate and the
labor force participation rate in 2017?
e. Did cyclical unemployment go up, go down, or stay the same in 2017?
Chapter 8: The Price Level and Inflation
5. Suppose the people of one nation are huge football fans and the only items they consume are
wings and beer. They consume them in the following amounts. Using 2015 as the base year,
calculate the price index for 2016.
Market Basket
2015 Price
2016 Price
Quantity
$7
$12
Wings
3
$6
Beer
2
$10
6. Use the below CPI data for the following questions:
Year
CPI
1967
33.4
1997
160.5
a. What was the inflation rate?
b. What would something that cost $45 dollars in 1967 cost in 1997?
Expert Solution
This question has been solved!
Explore an expertly crafted, step-by-step solution for a thorough understanding of key concepts.

Step by step
Solved in 2 steps with 1 images

Knowledge Booster


Learn more about
Need a deep-dive on the concept behind this application? Look no further. Learn more about this topic, economics and related others by exploring similar questions and additional content below.Recommended textbooks for you
Essentials of Economics (MindTap Course List)
Economics
ISBN:
9781337091992
Author:
N. Gregory Mankiw
Publisher:
Cengage Learning

Principles of Macroeconomics (MindTap Course List)
Economics
ISBN:
9781305971509
Author:
N. Gregory Mankiw
Publisher:
Cengage Learning

Principles of Microeconomics (MindTap Course List)
Economics
ISBN:
9781305971493
Author:
N. Gregory Mankiw
Publisher:
Cengage Learning
Essentials of Economics (MindTap Course List)
Economics
ISBN:
9781337091992
Author:
N. Gregory Mankiw
Publisher:
Cengage Learning
Principles of Macroeconomics (MindTap Course List)
Economics
ISBN:
9781305971509
Author:
N. Gregory Mankiw
Publisher:
Cengage Learning
Principles of Microeconomics (MindTap Course List)
Economics
ISBN:
9781305971493
Author:
N. Gregory Mankiw
Publisher:
Cengage Learning

Principles of Macroeconomics (MindTap Course List)
Economics
ISBN:
9781285165912
Author:
N. Gregory Mankiw
Publisher:
Cengage Learning

Principles of Economics 2e
Economics
ISBN:
9781947172364
Author:
Steven A. Greenlaw; David Shapiro
Publisher:
OpenStax

Principles of Economics (MindTap Course List)
Economics
ISBN:
9781305585126
Author:
N. Gregory Mankiw
Publisher:
Cengage Learning