1. The driving time from Toronto to Montreal are uniformly distributed with times ranging from 4 hour to 5.75 hours. Draw a probability density graph tha shows this (be sure to fully label your graph).
1. The driving time from Toronto to Montreal are uniformly distributed with times ranging from 4 hour to 5.75 hours. Draw a probability density graph tha shows this (be sure to fully label your graph).

Mathematics For Machine Technology
8th Edition
ISBN:9781337798310
Author:Peterson, John.
Publisher:Peterson, John.
Chapter29: Tolerance, Clearance, And Interference
Section: Chapter Questions
Problem 16A: Spacers are manufactured to the mean dimension and tolerance shown in Figure 29-12. An inspector...

Related questions
Question
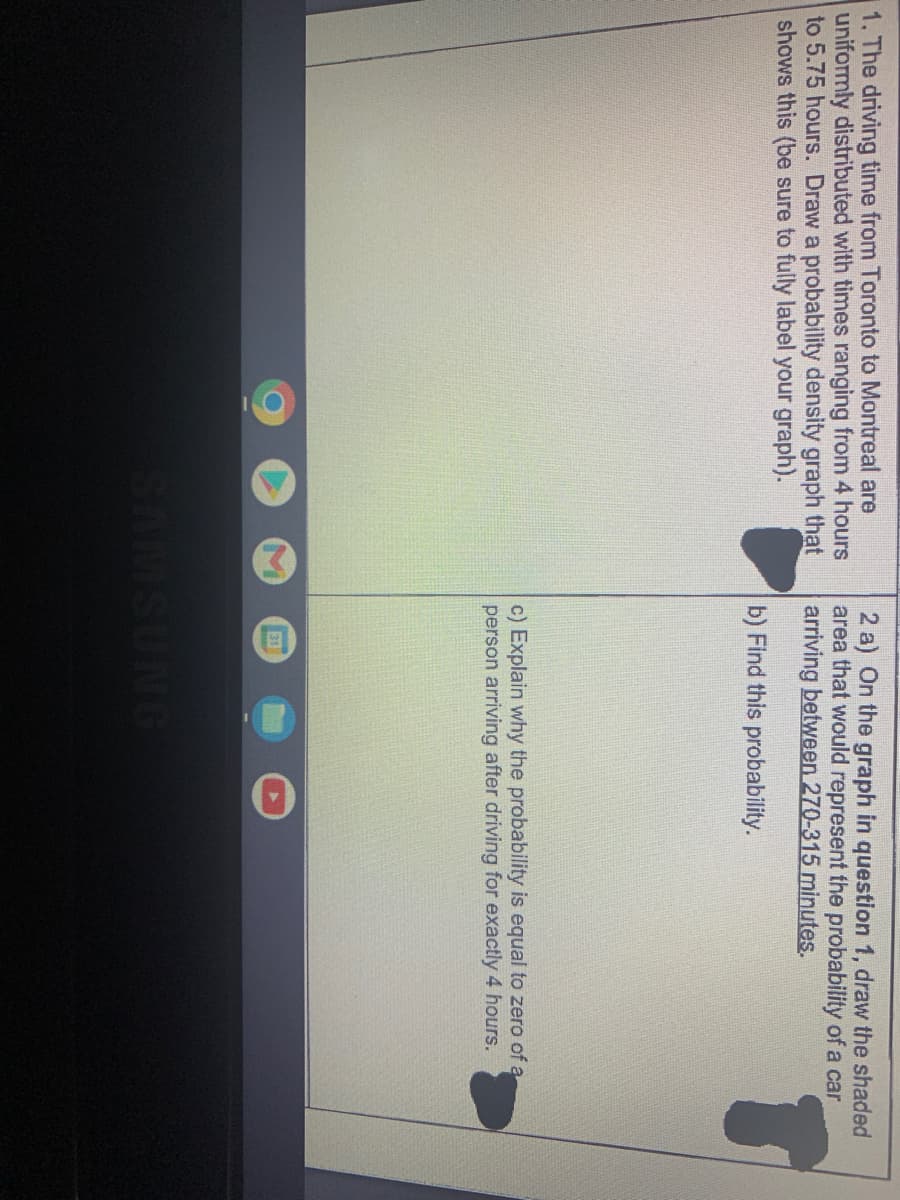
Transcribed Image Text:1. The driving time from Toronto to Montreal are
uniformly distributed with times ranging from 4 hours
to 5.75 hours. Draw a probability density graph that
shows this (be sure to fully label your graph).
2 a) On the graph in question 1, draw the shaded
area that would represent the probability of a car
arriving between 270-315 minutes.
b) Find this probability.
c) Explain why the probability is equal to zero of a
person arriving after driving for exactly 4 hours.
31
Expert Solution
This question has been solved!
Explore an expertly crafted, step-by-step solution for a thorough understanding of key concepts.

Step by step
Solved in 4 steps with 2 images

Recommended textbooks for you
Mathematics For Machine Technology
Advanced Math
ISBN:
9781337798310
Author:
Peterson, John.
Publisher:
Cengage Learning,
Mathematics For Machine Technology
Advanced Math
ISBN:
9781337798310
Author:
Peterson, John.
Publisher:
Cengage Learning,