1. The following data are average yields in bushels per acre on four plots of land for four different varieties of corn. Yield (bushels per acre) is the response variable and corn variety is the treatment variable with four levels. Variety 1: 68.8, 76.9, 74.3, 78.7 Variety 2: 86.8, 75.7, 77.9, 76.2 Variety 3: 90.2, 78.8, 80.6, 83.6 Variety 4: 61.6, 73.5, 74.6, 70.8 a. Calculate the treatment sample means. b. Does this data suggest a difference with respect to the true average yield among the corn varieties? Perform a test of hypotheses using a significance level of .05. State the hypotheses and significance level. Complete the ANOVA table. Source of Variation Between (factor) groups Within (error) groups Total Sum of Squares Degrees of freedom Mean Square Find the p-value and state your conclusion in terms of the problem. F- statistic
1. The following data are average yields in bushels per acre on four plots of land for four different varieties of corn. Yield (bushels per acre) is the response variable and corn variety is the treatment variable with four levels. Variety 1: 68.8, 76.9, 74.3, 78.7 Variety 2: 86.8, 75.7, 77.9, 76.2 Variety 3: 90.2, 78.8, 80.6, 83.6 Variety 4: 61.6, 73.5, 74.6, 70.8 a. Calculate the treatment sample means. b. Does this data suggest a difference with respect to the true average yield among the corn varieties? Perform a test of hypotheses using a significance level of .05. State the hypotheses and significance level. Complete the ANOVA table. Source of Variation Between (factor) groups Within (error) groups Total Sum of Squares Degrees of freedom Mean Square Find the p-value and state your conclusion in terms of the problem. F- statistic

Functions and Change: A Modeling Approach to College Algebra (MindTap Course List)
6th Edition
ISBN:9781337111348
Author:Bruce Crauder, Benny Evans, Alan Noell
Publisher:Bruce Crauder, Benny Evans, Alan Noell
Chapter5: A Survey Of Other Common Functions
Section5.3: Modeling Data With Power Functions
Problem 6E: Urban Travel Times Population of cities and driving times are related, as shown in the accompanying...

Related questions
Question
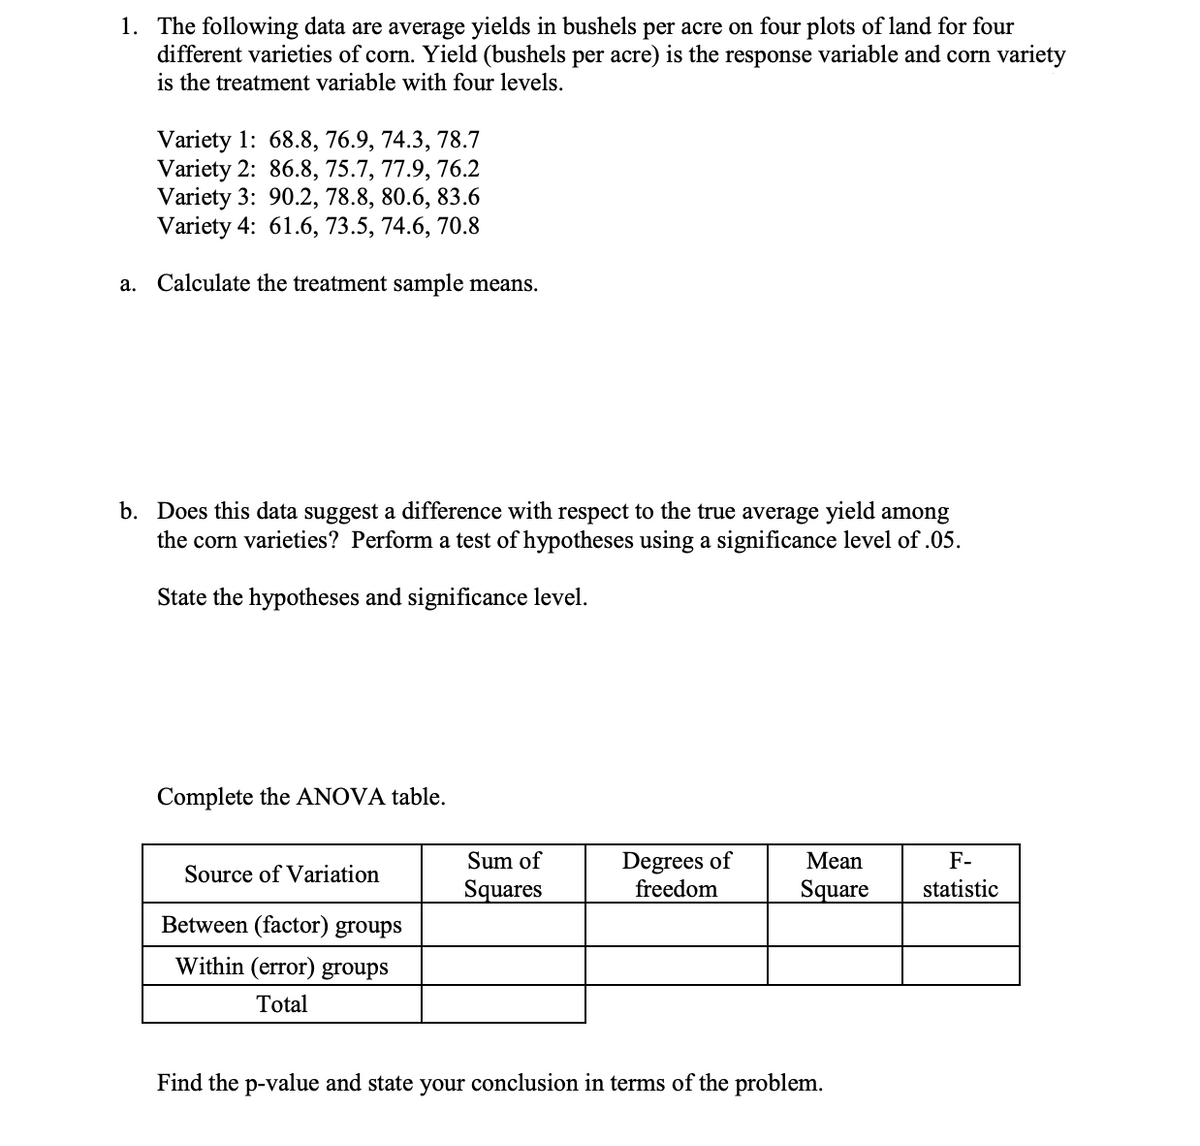
Transcribed Image Text:1. The following data are average yields in bushels per acre on four plots of land for four
different varieties of corn. Yield (bushels per acre) is the response variable and corn variety
is the treatment variable with four levels.
Variety 1: 68.8, 76.9, 74.3, 78.7
Variety 2: 86.8, 75.7, 77.9, 76.2
Variety 3: 90.2, 78.8, 80.6, 83.6
Variety 4: 61.6, 73.5, 74.6, 70.8
a. Calculate the treatment sample means.
b. Does this data suggest a difference with respect to the true average yield among
the corn varieties? Perform a test of hypotheses using a significance level of .05.
State the hypotheses and significance level.
Complete the ANOVA table.
Source of Variation
Between (factor) groups
Within (error) groups
Total
Sum of
Squares
Degrees of
freedom
Mean
Square
Find the p-value and state your conclusion in terms of the problem.
F-
statistic
Expert Solution
This question has been solved!
Explore an expertly crafted, step-by-step solution for a thorough understanding of key concepts.

Step by step
Solved in 3 steps with 1 images

Recommended textbooks for you
Functions and Change: A Modeling Approach to Coll…
Algebra
ISBN:
9781337111348
Author:
Bruce Crauder, Benny Evans, Alan Noell
Publisher:
Cengage Learning
Functions and Change: A Modeling Approach to Coll…
Algebra
ISBN:
9781337111348
Author:
Bruce Crauder, Benny Evans, Alan Noell
Publisher:
Cengage Learning