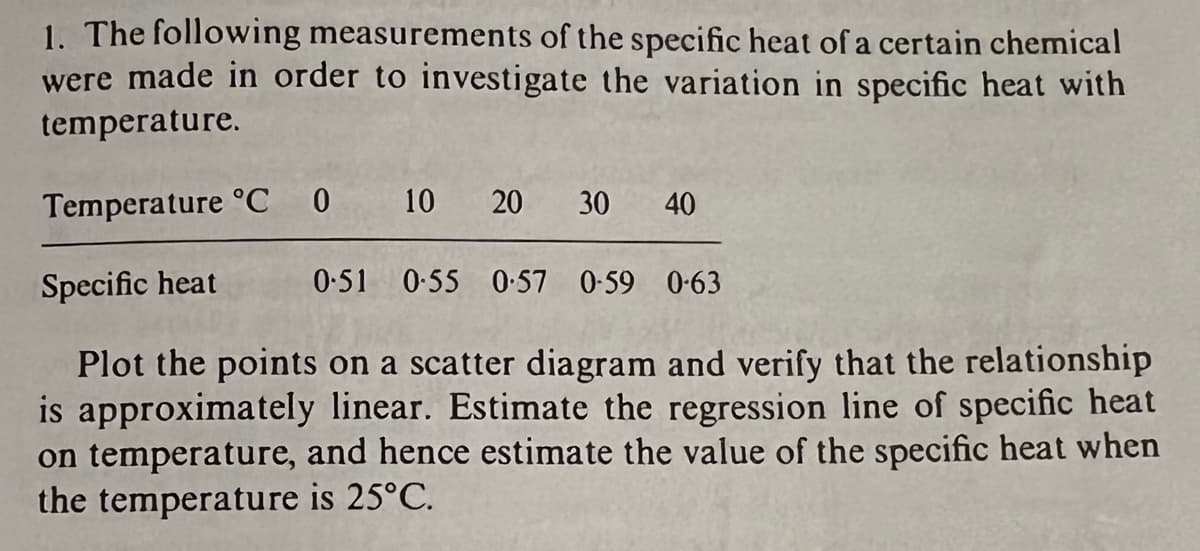
1. The following measurements of the specific he were made in order to investigate the variatio temperature. Temperature °C 0 Specific heat 10 20 30 40 0.51 0.55 0.57 0-59 0-63


Q: Medicare would like to test the hypothesis that the average monthly rate for one- bedroom…
A: Givensampele size(n)=12Mean(x)=3690standard deviation(s)=530significance level(α)=0.05
Q: Question 7 Suppose the distribution of Y, conditional on X, is n(x, x²) and that the marginal…
A:
Q: 2) A researcher is interested in studying if male smokers and female smokers smoke a different…
A: The test statistic in a research study is examined in this section information that is being used to…
Q: Random variables X and Y have a joint PMF described by the following table. y = -1 y = 0 y = 1 1/16…
A: Probability density function explain the probability occurrence of all the observations in a…
Q: Q10. Confounding occurs when” a. the confounding variable is related to none of the other…
A:
Q: Example 5: Find a 90% confidence interval for the mean difference in the mileage obtained for tires…
A:
Q: INSTRUCTION: Perform an appropriate statistical test using the dataset (Sheet name: Excretion) if a…
A: Mean is the measure of central tendency. The average value of the data set is calculated using the…
Q: In a random sample of 18 people, the mean commute time to work was 32.2 minutes and the standard…
A:
Q: A population is normally distributed with u=300 and a = 20. a. Find the probability that a value…
A:
Q: Ten novels were randomly selected, and the number of pages were recorded as follows: 415 398 402 399…
A:
Q: Express your answer in the format of E. $ +$
A: From given data we have: sample size = n=12 Mean=x¯=50.9 Standard deviation=S=2.3 Degrees of freedom…
Q: Find the critical value Zα/2 that corresponds to the given confidence level. 95% Za/2= (Round to two…
A: The question is about to find critical value Given : Confidence level = 0.95 To find : Critical…
Q: Assume that a sample is used to estimate a population mean . Find the 98% confidence interval for a…
A: Givensample size(n)=635Mean(x)=70.4standard deviation(s)=21.4Confidence interval=98%
Q: You want to see if violent videos games have any effect on aggression for middle school boys. So,…
A: Hypothesis Testing A procedure for estimating how well someone could anticipate data findings in a…
Q: the chart attached, what is the approximate mean value? a. 1.5 b. 2.5 c. 3.5 d. 4.5
A: From the histogram, We have to calculate mean value We know : In histogram X axis shows bin(x) Y…
Q: An engineer is going to redesign an ejection seat for an airplane. The seat was designed for pilots…
A: The mean is 157 and the standard deviation is 26.1.
Q: INSTRUCTION: Perform an appropriate statistical test using the dataset (Sheet name: Fruits) if a…
A: Given Information: Consider the given dataset: W X Y Z A 6.9 11 13.1 13.4 11.8 7.8 12.1…
Q: Let X₁ |Z| where Z N (0, 1) and X₂ variables. Let Y₁ = X² + X², Y₂ = X₁. Find the joint density of…
A:
Q: For the data points (-2, 1), (-1, 2), (0, 1), (1, 2), (2, 1) i. ii. iii. Find the least squares…
A: Given Information: Consider the given data points: -2,1,-1,2,0,1,1,2,2,1 From the above points the…
Q: The EPA wants to test a randomly selected sample of nn water specimens and estimate the mean daily…
A: It is given that margin of error (E) is 2 and the confidence level is 88.36%.
Q: In a test of the effectiveness of garlic for lowering cholesterol, 42 subjects were treated with…
A: Given,sample size(n)=42sample mean(x¯)=4.5standard deviation(s)=17.6degrees of…
Q: 11. Using Matrix approach, compute SSTO.
A: Mean of GWA: y¯=∑yn=25.2512=2.1041 SSTO Is given by: SSTO=∑(y−y¯)2
Q: You want to study whether music affects people’s ability to learn. You have 10 college students…
A: Test is that whether people's ability to learn ks effected by music.
Q: The slope for an independent variable X predicts where the regression line crosses the Y (dependent)…
A: Given: The slope for an independent variable X predicts where the regression line crosses the Y…
Q: 5. Suppose 7% of all households have no home telephone but depend completely on cell phones. Find…
A: “Since you have posted multiple questions , we will solve first question for you. To get the…
Q: At a high school reunion, a the 20 students in graduating from the class of 2001 got into a chat…
A: Given: Sample size n = 20 Formula Used: Median = 2(n+1)4thterm
Q: Use technology to find the P-value for the hypothesis test described below The claim is that for a…
A: Given that n=16,t=1.011 ( 2 tailed ) P value = ?
Q: Two of the five (5) foreign automobiles from an overseas shipment have slight paint blemishes. If an…
A: From given data: Total no. of automobiles =5 B=blemished N=Non-blemished There is 7, not 8 elements…
Q: a) A new machine is used to pack coffee powder. The mass of a packet follows a normal distribution…
A: The mean and standard deviation for the sample data are computed as follows:
Q: Assuming the population has an approximate no mean = 39 with a sample standard deviation Round the…
A: A sample size n=20 Sample mean=x=39 Sample standard deviation(s)=6 α=0.01
Q: The US Department of Energy reported that 48% of homes were heated by natural gas. A random sample…
A:
Q: Is there reason to believe that a relationship exists between heights of fathers and the heights of…
A:
Q: So what is the answer rounded to three decimal place
A: The hypothesized mean is 2.85.
Q: A sample mean, sample standard deviation, and sample size are given. Use the one-mean t-test to…
A: The following information has been given: Sample mean x¯ = 3.12 s = 0.59…
Q: A poll of 2,056 randomly selected adults showed that 90% of them own cell phones. The technology…
A: The following information has been provided: X=1848N=2056Sample p or p^=0.898833
Q: The following data set represents performance scores from a sample of participants in a psychology…
A: The formula to find sample standard deviation is as follows, s = ∑ x2-∑x2nn-1
Q: P(A) = 0.3, P(B) = 0.4, and P(A or B) = 0.7, then a. A and B are mutually exclusive (disjoint)…
A: It is given that P(A) = 0.3 P(B) = 0.4 P(A or B) = 0.7
Q: Single Americans In a recent year, about 22% of Americans 16 years and older are single. What…
A: It is given that n=210 and p=0.22.
Q: Are the years of education of a child dependent on the years of education of their parent? The table…
A:
Q: See image. For the regression line y = a + bx, what is the value of b? Round to 2 decimal places.…
A: The independent variable is x and the dependent variable is y.
Q: A sample mean, sample standard deviation, and sample size are given. Use the one-mean t-test to…
A: Sample mean x¯ = 43.9 s = 5.3 n = 15 α = 0.05
Q: a test of H0: μ = 8 versus Ha: μ ≠ 8, a sample of size 220 leads to a p-value of 0.034. Which of the…
A:
Q: The test statistic of z= -2.46 is obtained when testing the claim that p <0.65. a. Using a…
A: As per our guidelines we are suppose to answer only one question. Given,Test…
Q: Students A B C DEFG D Grade (x) 84 87 90 91 88 75 91 85 85 90 82 78 GWA (y) 1.75 2.00 3.00 2.75 2.75…
A: Given data, x y 84 1.75 87 2 90 3 91 2.75 88 2.75 75 1.25 91 2.5 85 2.25 85 2…
Q: Use the given data to find the equation of the regression line. Examine the scatterplot and identify…
A: Regression Analysis: A regression determines the connection or association between the non-causal…
Q: Let X, Y ~ E(X) be independent exponential random variables. Using the convolution theorem, show…
A: The Convolution theorem states that: Let X and Y be continuous independent random variables with pdf…
Q: 2. At Passmore University (PU) there are 600 students taking Physics or Calculus. 154 are taking…
A: The following information has been given: Let P represents Physics C represents Calculus…
Q: CNNBC recently reported that the mean annual cost of auto insurance is 1049 dollars. Assume the…
A:
Q: Simple linear correlation coefficient r can provide the direction, but not the strength of…
A: Simple linear correlation coefficient r can provide the direction, but not the strength of…
Q: Standardized tests: In a particular year, the mean score on the ACT test was 26.1 and the standard…
A:

Step by step
Solved in 3 steps with 1 images

- Find the equation of the regression line for the following data set. x 1 2 3 y 0 3 4The following fictitious table shows kryptonite price, in dollar per gram, t years after 2006. t= Years since 2006 0 1 2 3 4 5 6 7 8 9 10 K= Price 56 51 50 55 58 52 45 43 44 48 51 Make a quartic model of these data. Round the regression parameters to two decimal places.Olympic Pole Vault The graph in Figure 7 indicates that in recent years the winning Olympic men’s pole vault height has fallen below the value predicted by the regression line in Example 2. This might have occurred because when the pole vault was a new event there was much room for improvement in vaulters’ performances, whereas now even the best training can produce only incremental advances. Let’s see whether concentrating on more recent results gives a better predictor of future records. (a) Use the data in Table 2 (page 176) to complete the table of winning pole vault heights shown in the margin. (Note that we are using x=0 to correspond to the year 1972, where this restricted data set begins.) (b) Find the regression line for the data in part ‚(a). (c) Plot the data and the regression line on the same axes. Does the regression line seem to provide a good model for the data? (d) What does the regression line predict as the winning pole vault height for the 2012 Olympics? Compare this predicted value to the actual 2012 winning height of 5.97 m, as described on page 177. Has this new regression line provided a better prediction than the line in Example 2?
- A U.S. state's Bureau of Economic Geology published a study on the economic impact of using carbon dioxide enhanced oil recovery (EOR) technology to extract additional oil from fields that have reached the end of their conventional economic life. The following table gives the approximate number of jobs for the citizens that would be created at various levels of recovery. Percent Recovery (%) 20 40 80 100 Jobs Created (Millions) 6 9 12 18 Find the regression line. j(r) = Use the regression line to estimate the number of jobs that would be created at a recovery level of 60%. _____ million jobssuppose data were collected from a sample of 10 Pizza restaurants located near college campuses. For the ith observation or restaurant in the sample, x_i is the size of the student population (in hundreds) and y_i is the quarterly sales (in thousand of shillings). Restaurant 1 2 3 4 5 6 7 8 9 10 Student(100s) 2 6 8 8 12 16 20 20 22 26 Sales (Kshs.1000s) 58 105 88 118 117 137 157 169 149 202 Estimate the regression equation for the quarterly sales and the student population.Consider the following data for a dependent variable y and two independent variables, x1 and x2. x1 x2 y 30 12 94 47 10 108 25 17 112 51 16 178 40 5 94 51 19 175 74 7 170 36 12 117 59 13 142 76 16 211 (a) Develop an estimated regression equation relating y to x1. (Round your numerical values to one decimal place.) ŷ = −18.4+2+4.74x2 Predict y if x1 = 76. (Round your answer to one decimal place.) (b) Develop an estimated regression equation relating y to x2. (Round your numerical values to one decimal place.) ŷ = Predict y if x2 = 16. (Round your answer to one decimal place.) (c) Develop an estimated regression equation relating y to x1 and x2. (Round your numerical values to one decimal place.) ŷ = Predict y if x1 = 76 and x2 = 16. (Round your answer to one decimal place.)
- 6h. A sales manager collected the following data on x = years of experience and y = annual sales ($1,000s). The estimated regression equation for these data is ŷ = 83 + 4x. Salesperson Years ofExperience Annual Sales($1,000s) 1 1 80 2 3 97 3 4 102 4 4 107 5 6 103 6 8 116 7 10 119 8 10 123 9 11 127 10 13 136 (a) Compute SST, SSR, and SSE. SST=SSR=SSE= (b) Compute the coefficient of determination r2. (Round your answer to three decimal places.) r2 = (c) What is the value of the sample correlation coefficient? (Round your answer to three decimal places.)The following are data on the average weekly profits(in $1,000) of five restaurants, their seating capacities, andthe average daily traffic (in thousands of cars) that passestheir locations: Seating Traffic Weekly netcapacity count profitx1 x2 y120 19 23.8200 8 24.2150 12 22.0180 15 26.2240 16 33.5 (a) Assuming that the regression is linear, estimate β0, β1,and β2.(b) Use the results of part (a) to predict the averageweekly net profit of a restaurant with a seating capacityof 210 at a location where the daily traffic count averages14,000 cars.Obtain the equations of the lines of regression of Y on X from the following data.X : 12 18 24 30 36 42 48Y : 5.27 5.68 6.25 7.21 8.02 8.71 8.42 Estimate the most probable value of Y, when X = 40.
- A sales manager collected the following data on x = years of experience and y = annual sales ($1,000s). The estimated regression equation for these data is ŷ = 80 + 4x. Salesperson Years ofExperience Annual Sales($1,000s) 1 1 80 2 3 97 3 4 97 4 4 102 5 6 103 6 8 101 7 10 119 8 10 118 9 11 127 10 13 136 (a) Compute SST, SSR, and SSE. SST = SSR = SSE = (b) Compute the coefficient of determination r2. (Round your answer to three decimal places.) r2 = Comment on the goodness of fit. (For purposes of this exercise, consider a proportion large if it is at least 0.55.) The least squares line provided a good fit as a small proportion of the variability in y has been explained by the least squares line. The least squares line did not provide a good fit as a small proportion of the variability in y has been explained by the least squares line. The least squares line provided a good fit as a large proportion of the variability in y has been explained by the…A sales manager collected the following data on x = years of experience and y = annual sales ($1,000s). The estimated regression equation for these data is ŷ = 80 + 4x. Salesperson Years ofExperience Annual Sales($1,000s) 1 1 80 2 3 97 3 4 92 4 4 107 5 6 103 6 8 101 7 10 119 8 10 118 9 11 127 10 13 136 (a) Compute SST, SSR, and SSE. SST=SSR=SSE= (b) Compute the coefficient of determination r2. (Round your answer to three decimal places.) r2 = Comment on the goodness of fit. (For purposes of this exercise, consider a proportion large if it is at least 0.55.) The least squares line provided a good fit as a small proportion of the variability in y has been explained by the least squares line.The least squares line did not provide a good fit as a large proportion of the variability in y has been explained by the least squares line. The least squares line did not provide a good fit as a small proportion of the variability in y has been explained by…Consider the following data on x = rainfall volume (m3) and y = runoff volume (m3) for a particular location. x 4 12 14 20 23 30 40 47 55 67 72 83 96 112 127 y 4 10 13 14 15 25 27 46 38 46 53 75 82 99 104 Use the accompanying Minitab output to decide whether there is a useful linear relationship between rainfall and runoff. The regression equation isrunoff = -2.07 + 0.850 rainfall Predictor Coef Stdev t-ratio p Constant -2.067 2.412 -0.86 0.407 rainfall 0.85038 0.03708 22.93 0.000 s = 5.321 R-sq = 97.6% R-sq(adj) = 97.4% State the appropriate null and alternative hypotheses. H0: ?1 = 0 Ha: ?1 > 0 H0: ?1 = 0 Ha: ?1 ≠ 0 H0: ?1 = 0 Ha: ?1 < 0 H0: ?1 ≠ 0 Ha: ?1 = 0 Compute the test statistic value and find the P-value. (Round your test statistic to two decimal places and your P-value to three decimal places.) t = P-value = State the conclusion in the problem context. (Use ? = 0.05.) Reject H0. There is a useful linear relationship…

