1. The following sample of solar intensity measurements (watts/m2) was collected randomly on different days in southern Australia: 731 743 734 690 701 682 717 707 741 709 704 677 758 688 a) Should the assumption of normality be adopted for this dataset? Include the QQ plot constructed in R and comment how you use it to answer the question. b) Calculate and interpret the 95% confidence interval for the true mean solar intensity in southern Australia. c) Calculate and interpret the 95% upper confidence bound for the true mean solar intensity in southern Australia.
1. The following sample of solar intensity measurements (watts/m2) was collected randomly on different days in southern Australia: 731 743 734 690 701 682 717 707 741 709 704 677 758 688 a) Should the assumption of normality be adopted for this dataset? Include the QQ plot constructed in R and comment how you use it to answer the question. b) Calculate and interpret the 95% confidence interval for the true mean solar intensity in southern Australia. c) Calculate and interpret the 95% upper confidence bound for the true mean solar intensity in southern Australia.

Glencoe Algebra 1, Student Edition, 9780079039897, 0079039898, 2018
18th Edition
ISBN:9780079039897
Author:Carter
Publisher:Carter
Chapter10: Statistics
Section10.4: Distributions Of Data
Problem 19PFA

Related questions
Question
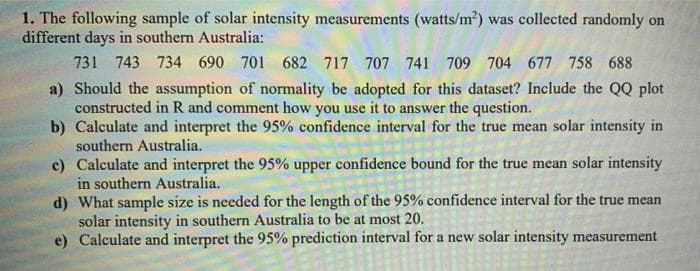
Transcribed Image Text:1. The following sample of solar intensity measurements (watts/m2) was collected randomly on
different days in southern Australia:
731 743 734 690 701 682 717 707 741 709 704 677 758 688
a) Should the assumption of normality be adopted for this dataset? Include the QQ plot
constructed in R and comment how you use it to answer the question.
b) Calculate and interpret the 95% confidence interval for the true mean solar intensity in
southern Australia.
c) Calculate and interpret the 95% upper confidence bound for the true mean solar intensity
in southern Australia.
d) What sample size is needed for the length of the 95% confidence interval for the true mean
solar intensity in southern Australia to be at most 20.
e) Calculate and interpret the 95% prediction interval for a new solar intensity measurement
Expert Solution
This question has been solved!
Explore an expertly crafted, step-by-step solution for a thorough understanding of key concepts.

This is a popular solution!

Trending now
This is a popular solution!

Step by step
Solved in 3 steps with 2 images

Recommended textbooks for you
Glencoe Algebra 1, Student Edition, 9780079039897…
Algebra
ISBN:
9780079039897
Author:
Carter
Publisher:
McGraw Hill
Glencoe Algebra 1, Student Edition, 9780079039897…
Algebra
ISBN:
9780079039897
Author:
Carter
Publisher:
McGraw Hill