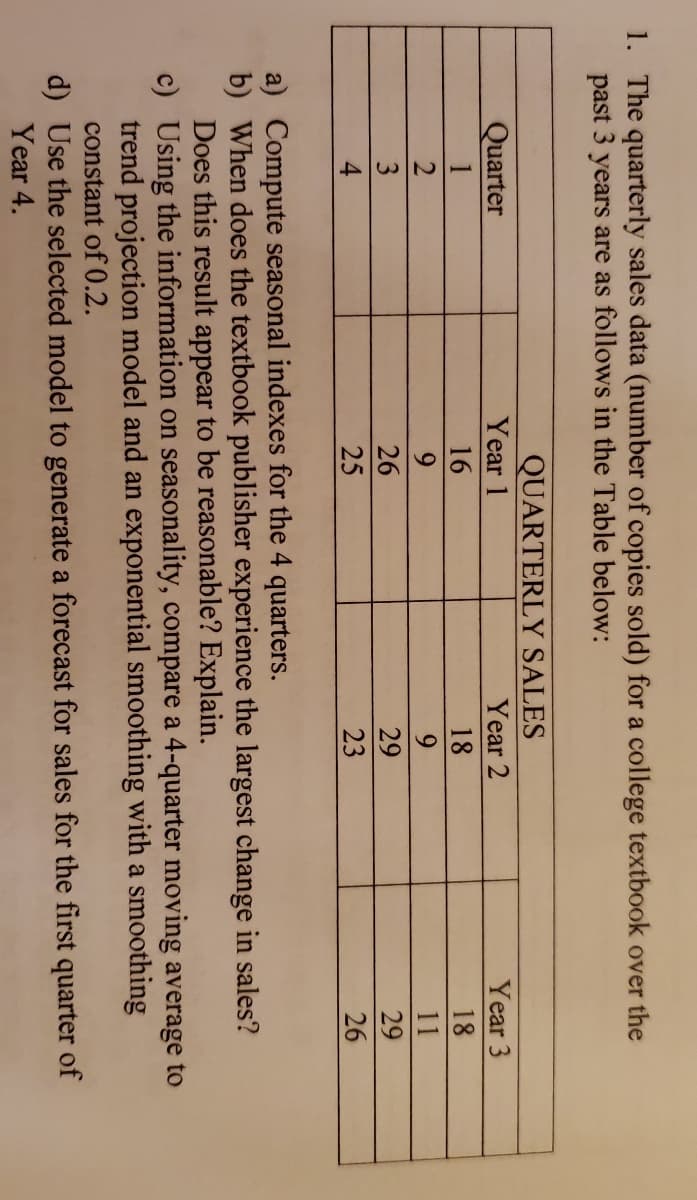
1. The quarterly sales data (number of copies sold) for a college textbook over the past 3 years are as follows in the Table below: QUARTERLY SALES Year 1 Quarter Year 2 Year 3 1 16 18 18 9. 9. 11 3 26 29 29 4 25 23 26 a) Compute seasonal indexes for the 4 quarters. b) When does the textbook publisher experience the largest change in sales? Does this result appear to be reasonable? Explain. c) Using the information on seasonality, compare a 4-quarter moving average to trend projection model and an exponential smoothing with a smoothing constant of 0.2. d) Use the selected model to generate a forecast for sales for the first quarter of Year 4
1. The quarterly sales data (number of copies sold) for a college textbook over the past 3 years are as follows in the Table below: QUARTERLY SALES Year 1 Quarter Year 2 Year 3 1 16 18 18 9. 9. 11 3 26 29 29 4 25 23 26 a) Compute seasonal indexes for the 4 quarters. b) When does the textbook publisher experience the largest change in sales? Does this result appear to be reasonable? Explain. c) Using the information on seasonality, compare a 4-quarter moving average to trend projection model and an exponential smoothing with a smoothing constant of 0.2. d) Use the selected model to generate a forecast for sales for the first quarter of Year 4

Glencoe Algebra 1, Student Edition, 9780079039897, 0079039898, 2018
18th Edition
ISBN:9780079039897
Author:Carter
Publisher:Carter
Chapter10: Statistics
Section10.6: Summarizing Categorical Data
Problem 31PPS

Related questions
Topic Video
Question
100%
Showing by using excel format, please solve the following:
Transcribed Image Text:1. The quarterly sales data (number of copies sold) for a college textbook over the
past 3 years are as follows in the Table below:
QUARTERLY SALES
Year 1
Quarter
Year 2
Year 3
16
18
18
9.
9.
11
3
26
29
29
25
23
26
a) Compute seasonal indexes for the 4 quarters.
b) When does the textbook publisher experience the largest change in sales?
Does this result appear to be reasonable? Explain.
c) Using the information on seasonality, compare a 4-quarter moving average to
trend projection model and an exponential smoothing with a smoothing
constant of 0.2.
d) Use the selected model to generate a forecast for sales for the first quarter of
Year 4.
Expert Solution
This question has been solved!
Explore an expertly crafted, step-by-step solution for a thorough understanding of key concepts.

This is a popular solution!

Trending now
This is a popular solution!

Step by step
Solved in 3 steps with 2 images

Knowledge Booster


Learn more about
Need a deep-dive on the concept behind this application? Look no further. Learn more about this topic, probability and related others by exploring similar questions and additional content below.Recommended textbooks for you
Glencoe Algebra 1, Student Edition, 9780079039897…
Algebra
ISBN:
9780079039897
Author:
Carter
Publisher:
McGraw Hill
Glencoe Algebra 1, Student Edition, 9780079039897…
Algebra
ISBN:
9780079039897
Author:
Carter
Publisher:
McGraw Hill