(a) Find the equation of the least-squares line for the data. (Round all numerical values to two decimal places.) = (b) Use the equation from part (a) to estimate the remaining lifetime of a woman of age 31. (Round your answer to the nearest year.) | yr (c) Is the procedure in part (b) an example of interpolation or extrapolation? O interpolation extrapolation
(a) Find the equation of the least-squares line for the data. (Round all numerical values to two decimal places.) = (b) Use the equation from part (a) to estimate the remaining lifetime of a woman of age 31. (Round your answer to the nearest year.) | yr (c) Is the procedure in part (b) an example of interpolation or extrapolation? O interpolation extrapolation

Linear Algebra: A Modern Introduction
4th Edition
ISBN:9781285463247
Author:David Poole
Publisher:David Poole
Chapter7: Distance And Approximation
Section7.3: Least Squares Approximation
Problem 31EQ

Related questions
Question
100%
The average remaining lifetimes for women of various ages in a certain country are given in the following table.
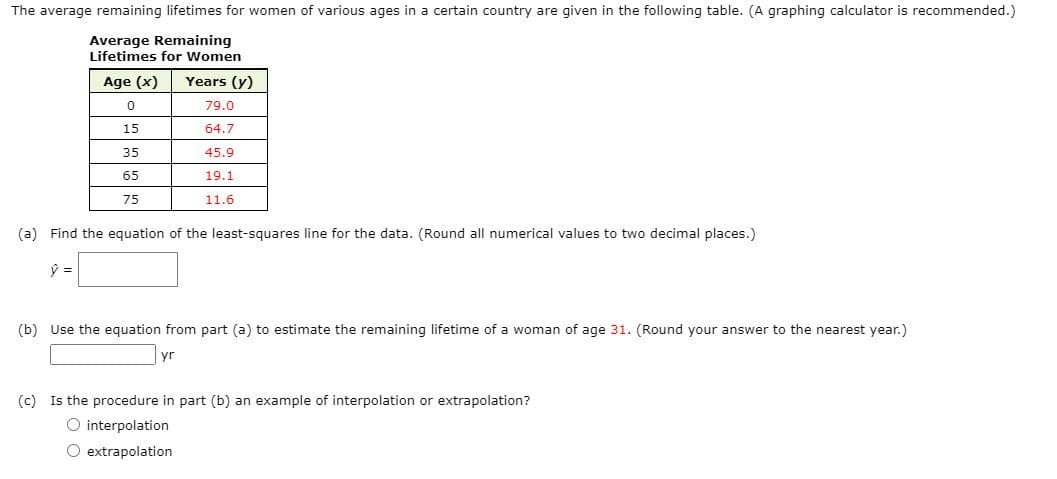
Transcribed Image Text:The average remaining lifetimes for women of various ages in a certain country are given in the following table. (A graphing calculator is recommended.)
Average Remaining
Lifetimes for Women
Age (x)
Years (y)
79.0
15
64.7
35
45.9
65
19.1
75
11.6
(a) Find the equation of the least-squares line for the data. (Round all numerical values to two decimal places.)
(b) Use the equation from part (a) to estimate the remaining lifetime of a woman of age 31. (Round your answer to the nearest year.)
yr
(c) Is the procedure in part (b) an example of interpolation or extrapolation?
interpolation
O extrapolation
Expert Solution
This question has been solved!
Explore an expertly crafted, step-by-step solution for a thorough understanding of key concepts.

Step by step
Solved in 3 steps

Recommended textbooks for you
Linear Algebra: A Modern Introduction
Algebra
ISBN:
9781285463247
Author:
David Poole
Publisher:
Cengage Learning

Trigonometry (MindTap Course List)
Trigonometry
ISBN:
9781305652224
Author:
Charles P. McKeague, Mark D. Turner
Publisher:
Cengage Learning
Linear Algebra: A Modern Introduction
Algebra
ISBN:
9781285463247
Author:
David Poole
Publisher:
Cengage Learning
Trigonometry (MindTap Course List)
Trigonometry
ISBN:
9781305652224
Author:
Charles P. McKeague, Mark D. Turner
Publisher:
Cengage Learning