1. The relationship between Grades and Minutes is best described as ??? and ??? 2. Use the computer output to complete the sentence: Each additional minute spent on social media is associated with a/an ??? in term percentage grade. of 3. What is the proportion of variability in term percentage grade that can be explained by the linear relationship to time spent on social media? 4. What is the expected value of Grades when Minutes is 0 minutes?
1. The relationship between Grades and Minutes is best described as ??? and ??? 2. Use the computer output to complete the sentence: Each additional minute spent on social media is associated with a/an ??? in term percentage grade. of 3. What is the proportion of variability in term percentage grade that can be explained by the linear relationship to time spent on social media? 4. What is the expected value of Grades when Minutes is 0 minutes?

Big Ideas Math A Bridge To Success Algebra 1: Student Edition 2015
1st Edition
ISBN:9781680331141
Author:HOUGHTON MIFFLIN HARCOURT
Publisher:HOUGHTON MIFFLIN HARCOURT
Chapter4: Writing Linear Equations
Section4.5: Analyzing Lines Of Fit
Problem 27E

Related questions
Topic Video
Question
Some help please ?
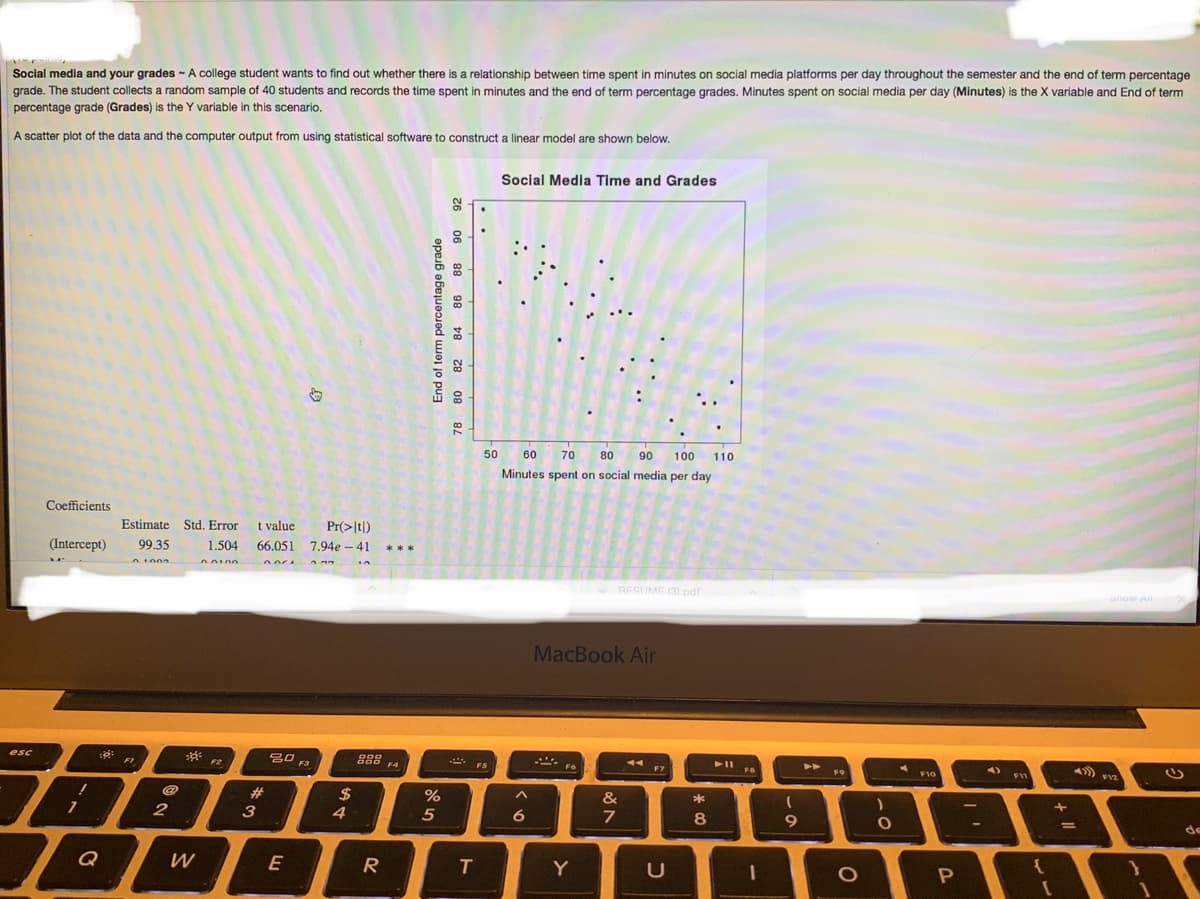
Transcribed Image Text:Social media and your grades - A college student wants to find out whether there is a relationship between time spent in minutes on social media platforms per day throughout the semester and the end of term percentage
grade. The student collects a random sample of 40 students and records the time spent in minutes and the end of term percentage grades. Minutes spent on social media per day (Minutes) is the X variable and End of term
percentage grade (Grades) is the Y variable in this scenario.
A scatter plot of the data and the computer output from using statistical software to construct a linear model are shown below.
Social Media Time and Grades
50
60
70
80
90
100
110
Minutes spent on social media per day
Coefficients
Estimate Std. Error
t value
Pr(>|t|)
(Intercept)
99.35
1.504
66.051 7.94e - 41
***
00100
RESUME (3).pdf
Show All
MacBook Air
esc
吕口
F3
FI
F2
II FD
F4
. ES
F7
4>
F9
F10
F11
F12
#3
3
2$
&
4
5
8
de
Q
E
R
T.
Y
U
End of term percentage grade
78 80 82 84 86 88 90
26
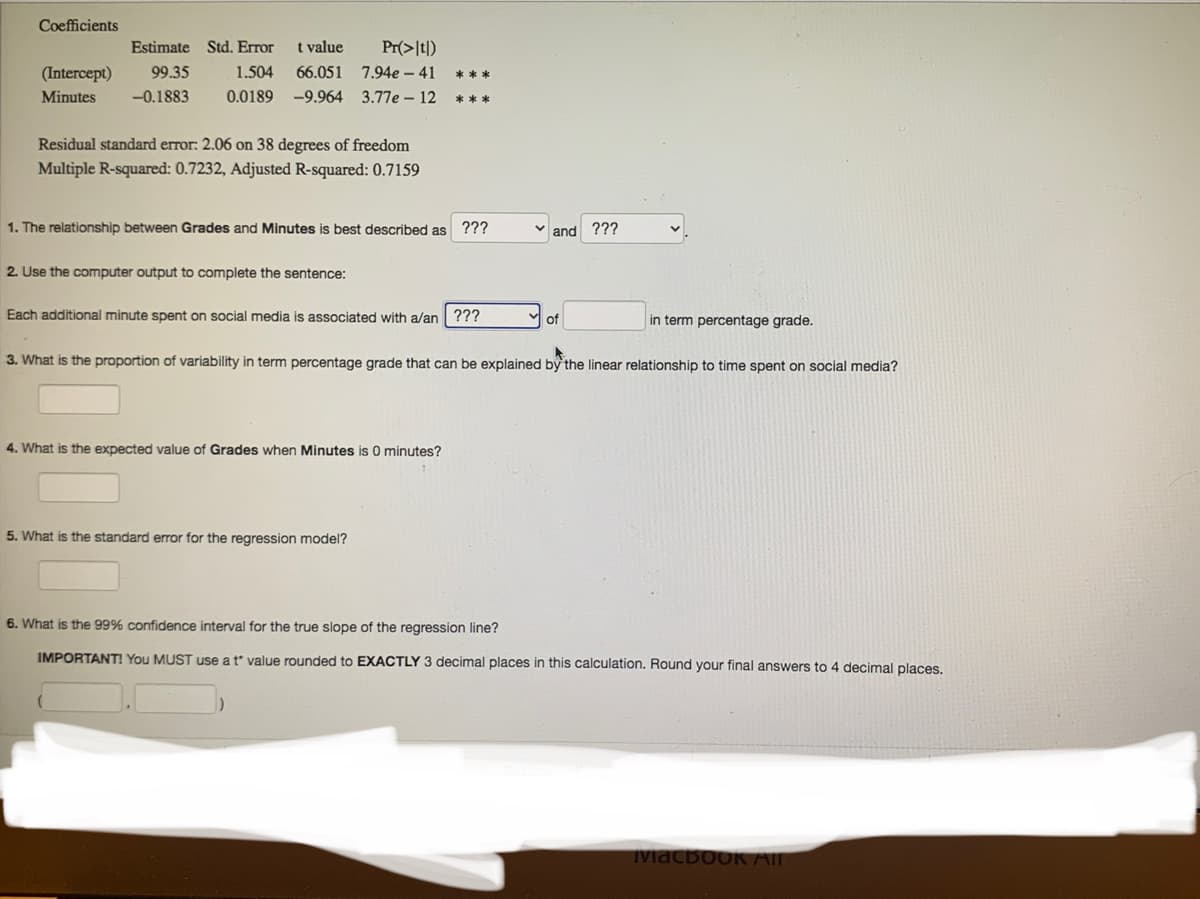
Transcribed Image Text:Coefficients
Estimate
Std. Error
t value
Pr(>It|)
(Intercept)
99.35
1.504
66.051 7.94e – 41
***
Minutes
-0.1883
0.0189
-9.964 3.77e – 12
***
Residual standard error: 2.06 on 38 degrees of freedom
Multiple R-squared: 0.7232, Adjusted R-squared: 0.7159
1. The relationship between Grades and Minutes is best described as ???
and ???
2. Use the computer output to complete the sentence:
Each additional minute spent on social media is associated with a/an| ???
of
in term percentage grade.
3. What is the proportion of variability in term percentage grade that can be explained by the linear relationship to time spent on social media?
4. What is the expected value of Grades when Minutes is O minutes?
5. What is the standard error for the regression model?
6. What is the 99% confidence interval for the true slope of the regression line?
IMPORTANT! You MUST use a t value rounded to EXACTLY 3 decimal places in this calculation. Round your final answers to 4 decimal places.
Macbook AI
Expert Solution
This question has been solved!
Explore an expertly crafted, step-by-step solution for a thorough understanding of key concepts.

Step by step
Solved in 2 steps

Knowledge Booster


Learn more about
Need a deep-dive on the concept behind this application? Look no further. Learn more about this topic, statistics and related others by exploring similar questions and additional content below.Recommended textbooks for you
Big Ideas Math A Bridge To Success Algebra 1: Stu…
Algebra
ISBN:
9781680331141
Author:
HOUGHTON MIFFLIN HARCOURT
Publisher:
Houghton Mifflin Harcourt

Glencoe Algebra 1, Student Edition, 9780079039897…
Algebra
ISBN:
9780079039897
Author:
Carter
Publisher:
McGraw Hill

Algebra and Trigonometry (MindTap Course List)
Algebra
ISBN:
9781305071742
Author:
James Stewart, Lothar Redlin, Saleem Watson
Publisher:
Cengage Learning
Big Ideas Math A Bridge To Success Algebra 1: Stu…
Algebra
ISBN:
9781680331141
Author:
HOUGHTON MIFFLIN HARCOURT
Publisher:
Houghton Mifflin Harcourt
Glencoe Algebra 1, Student Edition, 9780079039897…
Algebra
ISBN:
9780079039897
Author:
Carter
Publisher:
McGraw Hill
Algebra and Trigonometry (MindTap Course List)
Algebra
ISBN:
9781305071742
Author:
James Stewart, Lothar Redlin, Saleem Watson
Publisher:
Cengage Learning