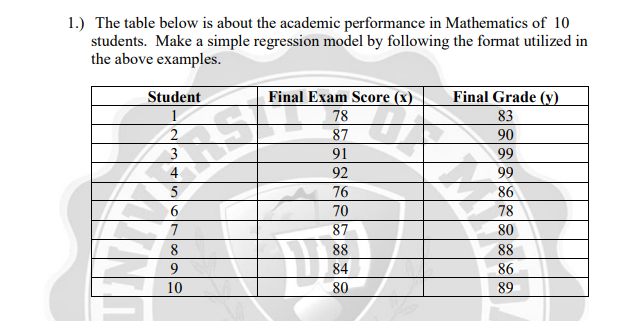
1.) The table below is about the academic performance in Mathematics of 10 students. Make a simple regression model by following the format utilized in the above examples. Final Exam Score (x) 78 87 Student Final Grade (y) 83 90 3 91 99 92 99 5 76 86 6. 70 78 87 80 88 88 84 86 10 80 89


Q: 1. What is the value of the correlation between Academic Performance and Digital Literacy? A. r =…
A: The provided information is Academic Performance (x) Digital Literacy store (y) xy x2 y2 87 91…
Q: 2. The following data show the age of a car and its average mileage/liter. Age (in years) 2 3 6.…
A: In the given context, consider Age as x and Mileage/Liter as y.
Q: Healthy Hamburgers has a chain of 12 stores in northern Illinois. Sales figures and profitsfor the…
A: It is given that Y is defined as the profit while X is defined as sales.
Q: Suppose the Sherwin-Williams Company is interested in developing a simple regression model with…
A: Enter Xi and Yi in excel sheet, Go to Data > Data Analysis> Regression Enter the range of X…
Q: Suppose we have the following dataset with one response to variable y and two predictor variables x,…
A: The dependent variable Y and two independent variables X1 and X2 are given as: y x1 x2 140 60…
Q: The number of initial public offerings of stock issued in a 10-year period and the total proceeds of…
A: Regression analysis
Q: 1. The table below shows the number of people, p, and suitcases, s, on 8 airplanes 63 115 153 192…
A:
Q: The table below shows the number of state-registered automatic weapons and the murder rate for…
A:
Q: 1. What is the value of the correlation between Academic Performance and Digital Literacy? A.…
A: Given that, A researcher is exploring the relationship of academic performance of students in an…
Q: 1. The table below lists U.S. fossil fuel consumption as a percentage of a total fuel consumption…
A:
Q: 1. there are two sets of data on the number of customers (in hundreds) and sales (in thousands in…
A:
Q: A psychologist collected data on a person's age and the number of hours per week that person spent…
A:
Q: 1. The grades of a class of 9 students on a midterm report (x) and on the final examination (y) are…
A: Note- Since you have posted multiple questions, as per our guidelines we are supposed to answer only…
Q: 7. The grades of a class of 9 students on a midterm report (x) and on the final examination (y) are…
A: Regression line is given by,
Q: The number of initial public offerings of stock issued in a 10-year period and the total proceeds…
A:
Q: What type of correlation exists between a person's age and the amount of sleep? O a. high positive O…
A: From the given data Select the correct choice
Q: 15. Given the data on the problem solving performance of a first year college student and their…
A:
Q: Suppose the Sherwin-Williams Company is interested in developing a simple regression model with…
A: Given that to complete the blank places of the table, so i XiXi YiYi XiXiYiYi Xi2Xi2 Yi2Yi2 1…
Q: The following data give the percentage of women working in five companies in the retail and trade…
A: 1 Use EXCEL to construct the sample regression equation. EXCEL procedure: Go to EXCEL Go to…
Q: Can you answer all parts of this question according to this data, please? 3. student 1 student 2…
A: a) Enter the data in cell C1 to C10. Here, the correlation coefficient is 0.6632 using the Excel…
Q: Which of the following is a multiple linear regression model? O Y= Bo+B1x + B2x² OY =Bo+B1x O…
A: Let us determine which one of the above is a multiple linear regression model in the next step.
Q: Consider the following data and create a linear regression model: Data 1 2 3 6 Y 6 6 11 12 O…
A:
Q: 1. The table below is about the academic performance in Mathematics of 10 students. Make a simple…
A:
Q: Find the equation of the regression line for the given data. -5 -3 4 -1 -2 3 11 -6 3 -4 -5 8. =…
A: The regression equation for one independent variable is, From the given information, Let X…
Q: The number of initial public offerings of stock issued in a 10-year period and the total proceeds of…
A: a) Scatterplot for x and y: Procedure to draw scatter plot using Excel software is given below:…
Q: 1. What is the value of the correlation between Academic Performance and Digital Literacy? A.…
A: “Since you have posted a question with multiple sub-parts, we will solve first three sub-parts for…
Q: The following data set shows the entrance exam score (Verbal GMAT) for each of eight MBA students…
A: Given, The following data set shows the entrance exam score (Verbal GMAT) for each of eight MBA…
Q: The number of initial public offerings of stock issued in a 10-year period and the total proceeds of…
A: Obtain the value of the standard error of estimate. The value of the standard error of estimate…
Q: The data obtained in a study on the number of absences in virtual class and the final grades of…
A: Regression is one of the important concepts of statistics, that is used to predict the unknown value…
Q: (ii) The following table shows the hearing test scores Y of people of different ages X. Age (X) 55…
A: Given X Y 55 2.5 40 3.8 35 3.7 30 3.9 42 3.5 48 3 50 2.2 45 3 44 3.2
Q: 1. The table below lists the scores of nine students in Chemistry and Physics tests. Student 1 4 8 9…
A: Given- The table below lists the scores of nine students in Chemistry and Physics tests. To find-…
Q: An auto manufacturing company wanted to investigate how the price of one of its car models…
A:
Q: The following table shows the amount of a chemical substance over time. Time (hours) Amount (mg)…
A: Linear regression is the process of estimating the dependent variable (Y) on the basis of the…
Q: Numbers of a particular type of sports cars sold in five different towns are given below, together…
A:
Q: The table below gives the estimated world population (in billions) for various years. 1980 1990 1997…
A: x y X - Mx Y - My (X - Mx)2 (X - Mx)(Y - My) 198019901997200020052011…
Q: Suppose the Sherwin-Williams Company is interested in developing a simple regression model with…
A: For the given data the regression output, as obtained in excel, is as follows Coefficients…
Q: The city wants to further develop the model to include the weather conditions of rainy, cloudy, or…
A: Introduction to linear regression analysis:Regression analysis is a collection of statistical…
Q: The number of initial public offerings of stock issued in a 10-year period and the total proceeds of…
A: Software procedure for regression in EXCEL.Enter the given data in EXCEL sheet as Issues in column A…
Q: 1. The accompanying table shows the number of movie theaters showing a popular film and the film's…
A:
Q: The table below contains the geographic latitudes, x, and average January temperatures, y, of 20…
A: Software procedure for regression in Excel.Enter the given data in EXCEL sheet as x in column A and…
Q: 17. The data below show the average ages and lengths of service in months for five randomly chosen…
A: 17) Given data, Age,x Time,y 24.9 66.5 25.6 70 26.1 74.8 27.3 89.6 27 82.6
Q: The data on incomes and food expenditures of the seven households given in the following table…
A: Given: Seven (n) households income and food expenditure shown in below table: Income (x) Food…
Q: The table below lists the scores of nine students in The table below lists the scores of nine…
A: a) Use EXCEL to obtain the value correlation coefficient r: EXCEL procedure: Go to EXCEL Go…
Q: Student 1 Student 2 Student 3 Student 4 Student 5 Student 6 Student 7 Student 8 Student 9…
A: Note: Hi there! Thank you for posting the question. As there are multiple sub parts, according to…
Q: 4) The data below are the number of absences and the final grades of 9 randomly selected students…
A: Given data: Number of absences 0 3 6 4 9 2 15 8 5 Final grade 98 86 80 82 71 92 55 76 82
Q: 1. What is the value of the correlation between Academic Performance and Digital Literacy? A. r =…
A: Given data is
Q: 18. Give the following data, which is the equation of the regression line? 3 12 2 6. 12 c. y = 4.98…
A: Note : We’ll answer the first question since the exact one wasn’t specified. Please submit a new…
Q: The following table shows the minimum wage rates for the United States during different years. Year…
A: Given Information: Consider the given data: Year Minimum hourly wage 1978 2.65 1979 2.90…
Q: Eight students are selected randomly, and their present graduate GPA is compared to their…
A: Introduction: Denote the response variable, Present GPA as y, and the explanatory variables, Undergr…
Q: The table below shows the number of state-registered automatic weapons and the murder rate for…
A: Regression: The regression analysis is conducted here by using EXCEL. The software procedure is…

Step by step
Solved in 2 steps with 1 images

- Olympic Pole Vault The graph in Figure 7 indicates that in recent years the winning Olympic men’s pole vault height has fallen below the value predicted by the regression line in Example 2. This might have occurred because when the pole vault was a new event there was much room for improvement in vaulters’ performances, whereas now even the best training can produce only incremental advances. Let’s see whether concentrating on more recent results gives a better predictor of future records. (a) Use the data in Table 2 (page 176) to complete the table of winning pole vault heights shown in the margin. (Note that we are using x=0 to correspond to the year 1972, where this restricted data set begins.) (b) Find the regression line for the data in part ‚(a). (c) Plot the data and the regression line on the same axes. Does the regression line seem to provide a good model for the data? (d) What does the regression line predict as the winning pole vault height for the 2012 Olympics? Compare this predicted value to the actual 2012 winning height of 5.97 m, as described on page 177. Has this new regression line provided a better prediction than the line in Example 2?The following fictitious table shows kryptonite price, in dollar per gram, t years after 2006. t= Years since 2006 0 1 2 3 4 5 6 7 8 9 10 K= Price 56 51 50 55 58 52 45 43 44 48 51 Make a quartic model of these data. Round the regression parameters to two decimal places.The following table shows the annual number of PhD graduates in a country in various fields. NaturalSciences Engineering SocialSciences Education 1990 70 10 60 30 1995 130 40 120 50 2000 330 130 280 140 2005 490 370 460 210 2010 590 550 830 520 2012 690 590 1,000 900 (a) With x = the number of social science doctorates and y = the number of education doctorates, use technology to obtain the regression equation. (Round coefficients to three significant digits.) y(x) = Graph the associated points and regression line. (b) What does the slope tell you about the relationship between the number of social science doctorates and the number of education doctorates? The slope tells us the increase in the number of education doctorates for each additional social science doctorate.The slope tells us the decrease in the number of education doctorates for each additional social science doctorate. The slope tells us the increase in the number…
- The following table shows the annual number of PhD graduates in a country in various fields. NaturalSciences Engineering SocialSciences Education 1990 70 10 70 30 1995 130 40 110 50 2000 330 130 280 140 2005 490 370 460 210 2010 590 550 830 520 2012 690 590 1,000 900 (a) With x = the number of social science doctorates and y = the number of education doctorates, use technology to obtain the regression equation. (Round coefficients to three significant digits.) y(x) = Graph the associated points and regression line. (b) What does the slope tell you about the relationship between the number of social science doctorates and the number of education doctorates? The slope tells us the increase in the number of social science doctorates for each additional education doctorate.The slope tells us the increase in the number of education doctorates for each additional social science doctorate. The slope tells us the decrease in the number…A random sample of twelve students were chosen, and their midterm test score (y), as- signment score (x1), and missed classes (x2) were recorded as follows: Midterm Score, y Assignment Score, x1 Classes Missed, x2 85 74 76 90 85 87 94 98 81 91 76 74 65 50 55 65 55 70 65 70 55 70 50 55 5 7 5 2 6 3 2 5 4 3 1 4 (i) What is the fitted multiple linear regression equation of the form yˆ = b0 + b1x1 + b2x2? (ii) From part (i) above, estimate the midterm test score grade for a student who has an assignment score of 60 and missed 4 classes.The following table shows the annual number of PhD graduates in a country in various fields. NaturalSciences Engineering SocialSciences Education 1990 70 10 60 30 1995 130 40 100 50 2000 330 130 280 140 2005 490 370 460 210 2010 590 550 830 520 2012 690 590 1,000 900 (a) With x = the number of social science doctorates and y = the number of education doctorates, use technology to obtain the regression equation. (Round coefficients to three significant digits.) y(x) =
- The following table shows the annual number of PhD graduates in a country in various fields. NaturalSciences Engineering SocialSciences Education 1990 70 10 60 30 1995 130 40 120 40 2000 330 130 280 120 2005 490 370 460 210 2010 590 550 830 520 2012 690 590 1,000 900 (a)With x = the number of social science doctorates and y = the number of education doctorates, use technology to obtain the regression equation. (Round coefficients to three significant digits.) y(x) =The following table shows the annual number of PhD graduates in a country in various fields. NaturalSciences Engineering SocialSciences Education 1990 70 10 70 30 1995 130 40 110 40 2000 330 130 280 120 2005 490 370 460 210 2010 590 550 830 520 2012 690 590 1,000 900 (a) With x = the number of social science doctorates and y = the number of education doctorates, use technology to obtain the regression equation. (Round coefficients to three significant digits.) y(x) = (b) Use technology to obtain the coefficient of correlation r. (Round your answer to three decimal places.) r =The table below shows the number of state-registered automatic weapons and the murder rate for several Northwestern states, where xx is thousands of automatic weapons and yy is murders per 100,000 residents. xx 11.3 8.2 7.1 3.7 2.9 2.2 2.1 0.6 yy 13.9 10.7 10.3 7.2 6.5 5.6 5.5 4.6 Use your calculator to determine the equation of the regression line and write it in the y=ax+by=ax+b form. Round to 2 decimal places. According to this model, how many murders per 100,000 residents can be expected in a state with 4.6 thousand automatic weapons? Round to 3 decimal places. According to this model, how many murders per 100,000 residents can be expected in a state with 4.4 thousand automatic weapons? Round to 3 decimal places.


