
MATLAB: An Introduction with Applications
6th Edition
ISBN: 9781119256830
Author: Amos Gilat
Publisher: John Wiley & Sons Inc
expand_more
expand_more
format_list_bulleted
Question

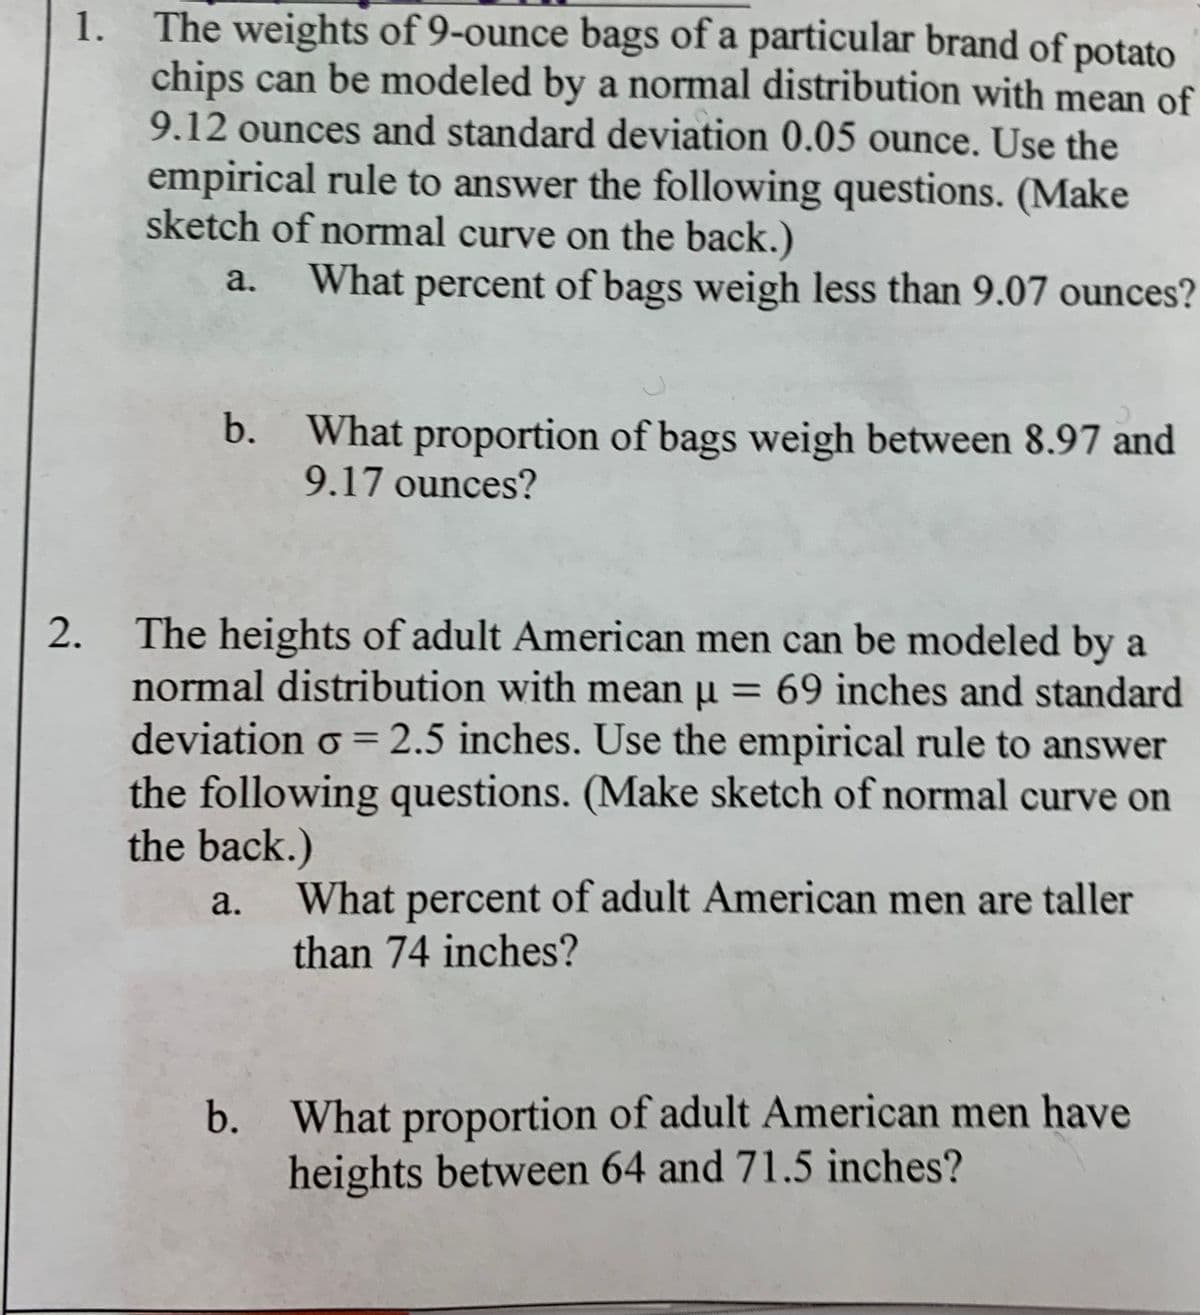
Transcribed Image Text:1. The weights of 9-ounce bags of a particular brand of potato
chips can be modeled by a normal distribution with mean of
9.12 ounces and standard deviation 0.05 ounce. Use the
empirical rule to answer the following questions. (Make
sketch of normal curve on the back.)
a. What percent of bags weigh less than 9.07 ounces?
b. What proportion of bags weigh between 8.97 and
9.17 ounces?
2. The heights of adult American men can be modeled by a
normal distribution with mean µ = 69 inches and standard
deviation o = 2.5 inches. Use the empirical rule to answer
the following questions. (Make sketch of normal curve on
the back.)
a.
What percent of adult American men are taller
than 74 inches?
b. What proportion of adult American men have
heights between 64 and 71.5 inches?
Expert Solution

This question has been solved!
Explore an expertly crafted, step-by-step solution for a thorough understanding of key concepts.
This is a popular solution
Trending nowThis is a popular solution!
Step by stepSolved in 2 steps with 1 images

Knowledge Booster
Similar questions
- The Acme Company manufactures widgets. The distribution of widget weights is bell-shaped. The widget weights have a mean of 39 ounces and a standard deviation of 10 ounces. Use the Empirical Rule. Suggestion: sketch the distribution in order to answer these questions. a) 99.7% of the widget weights lie between and b) What percentage of the widget weights lie between 29 and 69 ounces? c) What percentage of the widget weights lie below 59 ?arrow_forwardThe diameters of ball bearings produced in a manufacturing process can be described using a uniform distribution over the interval 8.5 to 10.5 millimeters. What is the mean diameter of ball bearings produced in this manufacturing process? A. 10 millimeters B. 10.5 millimeters C. 9.5 millimeters D. 9 millimetersarrow_forward1. Draw by hand or in Excel fully labelled curves on a common scale to represent two sets of scores where:a.Mean = 25, Standard Deviation = 4,Mean = 50, Standard Deviation = 4.b.Mean = 50, Standard Deviation = 2,Mean = 50, Standard Deviation = 5.arrow_forward
- please answer the question in the photo. Thank youarrow_forwardUse the Empirical Rule. The mean speed of a sample of vehicles along a stretch of highway per hour and 85 miles per hour. (Assume the data set has a bell-shaped distribution.) 70 miles per hour, with a standard deviation of 5 miles per hour. Estimate the percent of vehicles whese speeds are between 55 miles Approximately% of vehicles travel between 55 miles per hour and 85 miles per hour.arrow_forwardUse the Empirical Rule. The mean speed of a sample of vehicles along a stretch of highway is 68 miles per hour, with a standard deviation of 3 miles per hour. Estimate the percent of vehicles whose speeds are between 65 miles per hour and 71 miles per hour. (Assume the data set has a bell-shaped distribution.) Approximately nothing% of vehicles travel between 65 miles per hour and 71 miles per hour.arrow_forward
- 3. The fill volume of an automated filling machine used for filling cans of carbonated beverage isnormally distributed. Suppose that the mean of the filling operation can be adjusted easily, but thestandard deviation remains at 0.4 fluid ounce.a. At what value should the mean be set so that 99.9% of all cans exceed 12 fluid ounces?b. At what value should the mean be set so that 99.9% of all cans exceed 12 fluid ounces if thestandard deviation can be reduced to 0.09 fluid ounce?arrow_forwardConsider a sample data set with the summary statistics s= 112, Q = 58, and Q, =203. %3D a. Calculate IQR. b. Calculate IQR/s. c. Is the value of IQR/s approximately equal to 1.3? What does this imply? a. IQR =arrow_forwardSave In a study on infants, one of the characteristics measured was head circumference. The mean head circumference of 9 infants was 34.9 centimeters (cm). Complete parts (a) through (d) below. Click here to view Page 1 of the table of areas under the standard normal curve. Click here to view Page 2 of the table of areas under the standard normal curve. a. Assuming that head circumferences for infants are normally distributed with standard deviation 2.4 cm, determine a 95% confidence interval for the mean head circumference of all infants. The confidence interval for the mean head circumference of all infants is from cm to decimal place as needed.) cm. (Round to onearrow_forward
arrow_back_ios
arrow_forward_ios
Recommended textbooks for you
- MATLAB: An Introduction with ApplicationsStatisticsISBN:9781119256830Author:Amos GilatPublisher:John Wiley & Sons IncProbability and Statistics for Engineering and th...StatisticsISBN:9781305251809Author:Jay L. DevorePublisher:Cengage LearningStatistics for The Behavioral Sciences (MindTap C...StatisticsISBN:9781305504912Author:Frederick J Gravetter, Larry B. WallnauPublisher:Cengage Learning
- Elementary Statistics: Picturing the World (7th E...StatisticsISBN:9780134683416Author:Ron Larson, Betsy FarberPublisher:PEARSONThe Basic Practice of StatisticsStatisticsISBN:9781319042578Author:David S. Moore, William I. Notz, Michael A. FlignerPublisher:W. H. FreemanIntroduction to the Practice of StatisticsStatisticsISBN:9781319013387Author:David S. Moore, George P. McCabe, Bruce A. CraigPublisher:W. H. Freeman

MATLAB: An Introduction with Applications
Statistics
ISBN:9781119256830
Author:Amos Gilat
Publisher:John Wiley & Sons Inc

Probability and Statistics for Engineering and th...
Statistics
ISBN:9781305251809
Author:Jay L. Devore
Publisher:Cengage Learning

Statistics for The Behavioral Sciences (MindTap C...
Statistics
ISBN:9781305504912
Author:Frederick J Gravetter, Larry B. Wallnau
Publisher:Cengage Learning

Elementary Statistics: Picturing the World (7th E...
Statistics
ISBN:9780134683416
Author:Ron Larson, Betsy Farber
Publisher:PEARSON

The Basic Practice of Statistics
Statistics
ISBN:9781319042578
Author:David S. Moore, William I. Notz, Michael A. Fligner
Publisher:W. H. Freeman

Introduction to the Practice of Statistics
Statistics
ISBN:9781319013387
Author:David S. Moore, George P. McCabe, Bruce A. Craig
Publisher:W. H. Freeman