1. To determine the mode, median, Q₁, Q3, D6, P45, and P88, what auxiliary table would you determine ? . Use the following frequency table to determine the summary statistics in a.
1. To determine the mode, median, Q₁, Q3, D6, P45, and P88, what auxiliary table would you determine ? . Use the following frequency table to determine the summary statistics in a.

Algebra & Trigonometry with Analytic Geometry
13th Edition
ISBN:9781133382119
Author:Swokowski
Publisher:Swokowski
Chapter10: Sequences, Series, And Probability
Section10.8: Probability
Problem 32E

Related questions
Question
100%
could you please answer it with pen and paper?
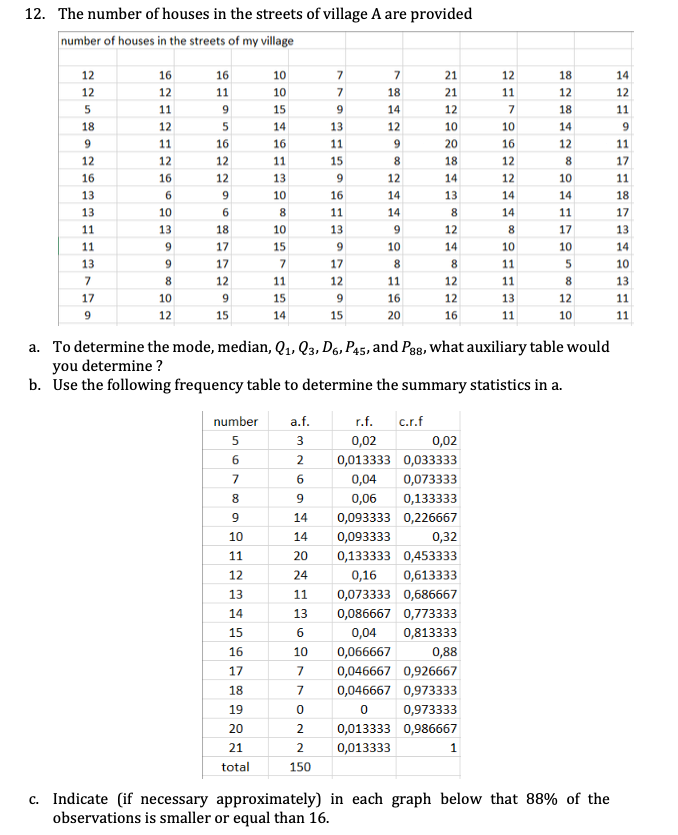
Transcribed Image Text:12. The number of houses in the streets of village A are provided
number of houses in the streets of my village
22589
12
12
18
12
16
13
13
11
11
13
7
17
9
16
12
11
12
11
12
16
6
10
13
9
9
8
22
10
12
16
11
9
5
16
12
12
9
6
18
17
17
12
9
15
10
10
15
14
16
11
13
10
567
8
10
15
7
11
15
14
8
9
10
11
12
13
14
15
16
17
18
19
20
21
total
7
7
9
13
11
15
9
16
11
13
9
17
12
9
7
7
0
2
2
150
15
7842
18
14
12
9
8
12
14
14
9
10
8
152
11
16
20
21
ಸ ಸ 99 0
21
12
10
20
18
14
13
8
12
AN
14
8
N 00
12
number a.f.
r.f. c.r.f
0,02
3
0,02
2
0,013333 0,033333
6
0,04
0,073333
9
0,06
0,133333
14 0,093333 0,226667
14
20
24
11
13
6
12
16
0,093333
0,32
0,133333 0,453333
0,16
0,613333
0,073333 0,686667
0,086667 0,773333
0,04
0,813333
10 0,066667
0,88
0,046667 0,926667
0,046667 0,973333
0,973333
0
0,013333 0,986667
0,013333
12
11
7
1
10
16
12
12
14
14
8
10
11
a. To determine the mode, median, Q₁, Q3, D6, P45, and P88, what auxiliary table would
you determine?
b. Use the following frequency table to determine the summary statistics in a.
11
13
11
18
12
18
14
12
8
10
14
11
17
10
5
829
12
10
c. Indicate (if necessary approximately) in each graph below that 88% of the
observations is smaller or equal than 16.
14
NA
12
11
9
11
17
11
18
17
13
14
10
13
11
11
Expert Solution
This question has been solved!
Explore an expertly crafted, step-by-step solution for a thorough understanding of key concepts.

Step by step
Solved in 5 steps

Recommended textbooks for you
Algebra & Trigonometry with Analytic Geometry
Algebra
ISBN:
9781133382119
Author:
Swokowski
Publisher:
Cengage

Holt Mcdougal Larson Pre-algebra: Student Edition…
Algebra
ISBN:
9780547587776
Author:
HOLT MCDOUGAL
Publisher:
HOLT MCDOUGAL

Algebra & Trigonometry with Analytic Geometry
Algebra
ISBN:
9781133382119
Author:
Swokowski
Publisher:
Cengage
Holt Mcdougal Larson Pre-algebra: Student Edition…
Algebra
ISBN:
9780547587776
Author:
HOLT MCDOUGAL
Publisher:
HOLT MCDOUGAL
