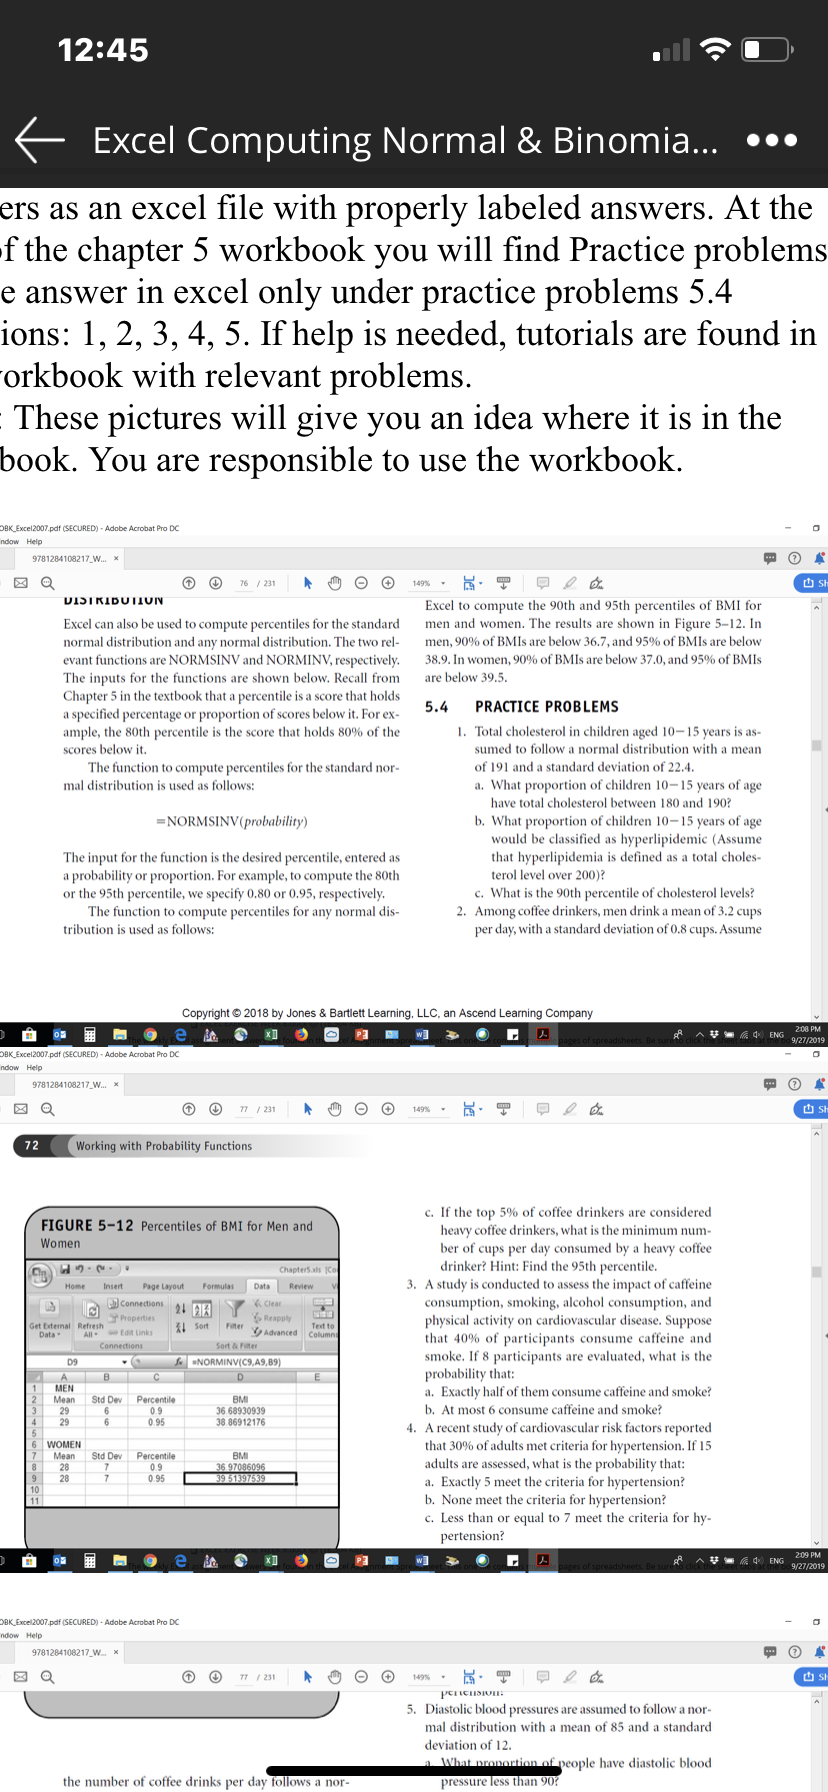
1. Total cholesterol in children aged 10–15 years is as- sumed to follow a normal distribution with a mean of 191 and a standard deviation of 22.4. a. What proportion of children 10–15 years of age have total cholesterol between 180 and 190? b. What proportion of children 10–15 years of age would be classified as hyperlipidemic (Assume that hyperlipidemia is defined as a total choles- terol level over 200)? c. What is the 90th percentile of cholesterol levels?

Algebra & Trigonometry with Analytic Geometry
13th Edition
ISBN:9781133382119
Author:Swokowski
Publisher:Swokowski
Chapter5: Inverse, Exponential, And Logarithmic Functions
Section5.6: Exponential And Logarithmic Equations
Problem 64E
icon
Related questions
icon
Concept explainers
Question
12:45
E Excel Computing Normal & Binomia... •..
ers as an excel file with properly labeled answers. At the
f the chapter 5 workbook you will find Practice problems
e answer in excel only under practice problems 5.4
ions: 1, 2, 3, 4, 5. If help is needed, tutorials are found in
Forkbook with relevant problems.
These pictures will give you an idea where it is in the
book. You are resp
onsible to use the workbook.
OBK_Excel2007.pdf (SECURED) - Adobe Acrobat Pro DC
ndow Help
9781284108217_W. x
76 / 231
149%-
VISTRIBUTION
Excel to compute the 90th and 95th percentiles of BMI for
men and women. The results are shown in Figure 5-12. In
Excel can also be used to compute percentiles for the standard
normal distribution and any normal distribution. The two rel-
men, 90% of BMIS are below 36.7, and 95% of BMIS are below
38.9. In women, 90% of BMIS are below 37.0, and 95% of BMIS
evant functions are NORMSINV and NORMINV, respectively.
The inputs for the functions are shown below. Recall from
Chapter 5 in the textbook that a percentile is a score that holds
a specified percentage or proportion of scores below it. For ex-
ample, the 80th percentile is the score that holds 80% of the
are below 39,5.
5.4
PRACTICE PROBLEMS
1. Total cholesterol in children aged 10-15 years is as-
sumed to follow a normal distribution with a mean
scores below it.
The function to compute percentiles for the standard nor-
of 191 and a standard deviation of 22.4.
a. What proportion of children 10–15 years of age
have total cholesterol between 180 and 190?
mal distribution is used as follows:
b. What proportion of children 10-15 years of age
would be classified as hyperlipidemic (Assume
that hyperlipidemia is defined as a total choles-
terol level over 200)?
c. What is the 90th percentile of cholesterol levels?
2. Among coffee drinkers, men drink a mean of 3.2 cups
per day, with a standard deviation of 0.8 cups. Assume
=NORMSINV(probability)
The input for the function is the desired percentile, entered as
a probability or proportion. For example, to compute the 80th
or the 95th percentile, we specify 0.80 or 0.95, respectively.
The function to compute percentiles for any normal dis-
tribution is used as follows:
Copyright © 2018 by Jones & Bartlett Learning, LLC, an Ascend Learning Company
208 PM
V- A 4 ENG
9/27/2019
DBK Excel2007.pdf (SECURED) - Adobe Acrobat Pro DC
ndow Help
9781284108217 W. x
77 / 231
149%
O Sh
72
Working with Probability Functions
c. If the top 5% of coffee drinkers are considered
heavy coffee drinkers, what is the minimum num-
ber of cups per day consumed by a heavy coffee
drinker? Hint: Find the 95th percentile.
3. A study is conducted to assess the
consumption, smoking, alcohol consumption, and
physical activity on cardiovascular disease. Suppose
that 40% of participants consume caffeine and
smoke. If 8 participants are evaluated, what is the
probability that:
a. Exactly half of them consume caffeine and smoke?
b. At most 6 consume caffeine and smoke?
4. A recent study of cardiovascular risk factors reported
that 30% of adults met criteria for hypertension. If 15
FIGURE 5-12 Percentiles of BMI for Men and
Women
Chapters.als (Co
of caffeine
Page I
Connections1
Home
Insert
Revie
K Clear
Reapoly
Advanced
Properties
Get External Refresh
Data
3I Sort
Columns
All
Connections
Sort & Fiter
D9
SNORMINV(C9,A9,89)
MEN
Percentile
0.9
0.95
Mean
Std Dev
BMI
29
29
36 68930939
38.86912176
WOMEN
Mean
28
Percentile
0.9
0.95
Std Dev
BMI
36 97086096
39 51397539
adults are assessed, what is the probability that:
28
a. Exactly 5 meet the criteria for hypertension?
b. None meet the criteria for hypertension?
c. Less than or equal to 7 meet the criteria for hy-
10
pertension?
209 PM
^V 4 ENG 9/27/2019
OBK Excel2007.pdf (SECURED) - Adobe Acrobat Pro DC
ndow Help
9781284108217_w. x
77 / 231
149%
5. Diastolic blood pressures are assumed to follow a nor-
mal distribution with a mean of 85 and a standard
deviation of 12.
a What pronortion of people have djastolic blood
the number of coffee drinks per day follows a nor-
pressure less than 90?
Transcribed Image Text:12:45 E Excel Computing Normal & Binomia... •.. ers as an excel file with properly labeled answers. At the f the chapter 5 workbook you will find Practice problems e answer in excel only under practice problems 5.4 ions: 1, 2, 3, 4, 5. If help is needed, tutorials are found in Forkbook with relevant problems. These pictures will give you an idea where it is in the book. You are resp onsible to use the workbook. OBK_Excel2007.pdf (SECURED) - Adobe Acrobat Pro DC ndow Help 9781284108217_W. x 76 / 231 149%- VISTRIBUTION Excel to compute the 90th and 95th percentiles of BMI for men and women. The results are shown in Figure 5-12. In Excel can also be used to compute percentiles for the standard normal distribution and any normal distribution. The two rel- men, 90% of BMIS are below 36.7, and 95% of BMIS are below 38.9. In women, 90% of BMIS are below 37.0, and 95% of BMIS evant functions are NORMSINV and NORMINV, respectively. The inputs for the functions are shown below. Recall from Chapter 5 in the textbook that a percentile is a score that holds a specified percentage or proportion of scores below it. For ex- ample, the 80th percentile is the score that holds 80% of the are below 39,5. 5.4 PRACTICE PROBLEMS 1. Total cholesterol in children aged 10-15 years is as- sumed to follow a normal distribution with a mean scores below it. The function to compute percentiles for the standard nor- of 191 and a standard deviation of 22.4. a. What proportion of children 10–15 years of age have total cholesterol between 180 and 190? mal distribution is used as follows: b. What proportion of children 10-15 years of age would be classified as hyperlipidemic (Assume that hyperlipidemia is defined as a total choles- terol level over 200)? c. What is the 90th percentile of cholesterol levels? 2. Among coffee drinkers, men drink a mean of 3.2 cups per day, with a standard deviation of 0.8 cups. Assume =NORMSINV(probability) The input for the function is the desired percentile, entered as a probability or proportion. For example, to compute the 80th or the 95th percentile, we specify 0.80 or 0.95, respectively. The function to compute percentiles for any normal dis- tribution is used as follows: Copyright © 2018 by Jones & Bartlett Learning, LLC, an Ascend Learning Company 208 PM V- A 4 ENG 9/27/2019 DBK Excel2007.pdf (SECURED) - Adobe Acrobat Pro DC ndow Help 9781284108217 W. x 77 / 231 149% O Sh 72 Working with Probability Functions c. If the top 5% of coffee drinkers are considered heavy coffee drinkers, what is the minimum num- ber of cups per day consumed by a heavy coffee drinker? Hint: Find the 95th percentile. 3. A study is conducted to assess the consumption, smoking, alcohol consumption, and physical activity on cardiovascular disease. Suppose that 40% of participants consume caffeine and smoke. If 8 participants are evaluated, what is the probability that: a. Exactly half of them consume caffeine and smoke? b. At most 6 consume caffeine and smoke? 4. A recent study of cardiovascular risk factors reported that 30% of adults met criteria for hypertension. If 15 FIGURE 5-12 Percentiles of BMI for Men and Women Chapters.als (Co of caffeine Page I Connections1 Home Insert Revie K Clear Reapoly Advanced Properties Get External Refresh Data 3I Sort Columns All Connections Sort & Fiter D9 SNORMINV(C9,A9,89) MEN Percentile 0.9 0.95 Mean Std Dev BMI 29 29 36 68930939 38.86912176 WOMEN Mean 28 Percentile 0.9 0.95 Std Dev BMI 36 97086096 39 51397539 adults are assessed, what is the probability that: 28 a. Exactly 5 meet the criteria for hypertension? b. None meet the criteria for hypertension? c. Less than or equal to 7 meet the criteria for hy- 10 pertension? 209 PM ^V 4 ENG 9/27/2019 OBK Excel2007.pdf (SECURED) - Adobe Acrobat Pro DC ndow Help 9781284108217_w. x 77 / 231 149% 5. Diastolic blood pressures are assumed to follow a nor- mal distribution with a mean of 85 and a standard deviation of 12. a What pronortion of people have djastolic blood the number of coffee drinks per day follows a nor- pressure less than 90?
Expert Solution
trending now

Trending now

This is a popular solution!

steps

Step by step

Solved in 5 steps

Blurred answer
Knowledge Booster
Continuous Probability Distribution
Learn more about
Need a deep-dive on the concept behind this application? Look no further. Learn more about this topic, statistics and related others by exploring similar questions and additional content below.
Similar questions
Recommended textbooks for you
Algebra & Trigonometry with Analytic Geometry
Algebra
ISBN:
9781133382119
Author:
Swokowski
Publisher:
Cengage
Linear Algebra: A Modern Introduction
Algebra
ISBN:
9781285463247
Author:
David Poole
Publisher:
Cengage Learning
Functions and Change: A Modeling Approach to Coll…
Algebra
ISBN:
9781337111348
Author:
Bruce Crauder, Benny Evans, Alan Noell
Publisher:
Cengage Learning
College Algebra
College Algebra
Algebra
ISBN:
9781305115545
Author:
James Stewart, Lothar Redlin, Saleem Watson
Publisher:
Cengage Learning
Trigonometry (MindTap Course List)
Trigonometry
ISBN:
9781337278461
Author:
Ron Larson
Publisher:
Cengage Learning