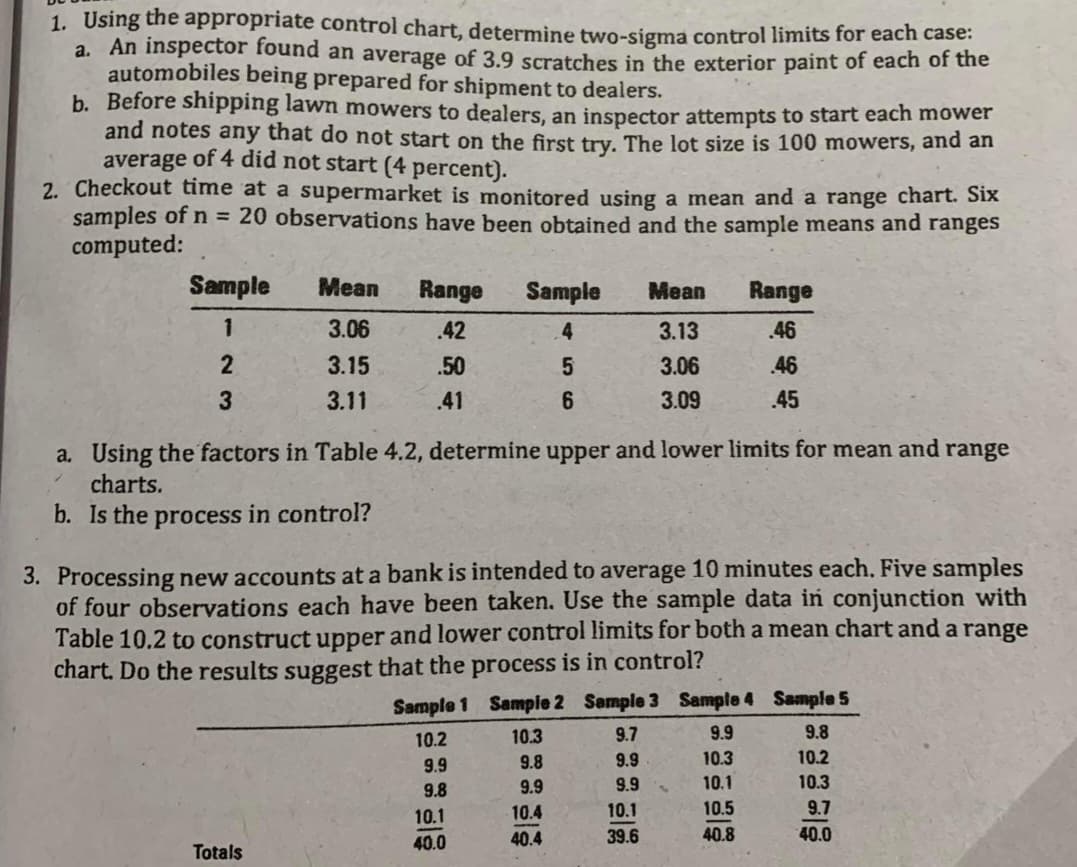
1. Using the appropriate control chart, determine two-sigma control limits for each case: a. An inspector found an average of 3.9 scratches in the exterior paint of each of the automobiles being prepared for shipment to dealers. b. Before shipping lawn mowers to dealers, an inspector attempts to start each mower and notes any that do not start on the first try. The lot size is 100 mowers, and an average of 4 did not start (4 percent). 2. Checkout time at a supermarket is monitored using a mean and a range chart. Six samples of n = 20 observations have been obtained and the sample means and ranges computed: Sample Mean Range Sample Mean Range 1 3.06 .42 4 3.13 46 3.15 .50 3.06 46 3 3.11 .41 6. 3.09 .45 a. Using the factors in Table 4.2, determine upper and lower limits for mean and range charts. b. Is the process in control? 3. Processing new accounts at a bank is intended to average 10 minutes each. Five samples of four observations each have been taken. Use the sample data in conjunction with Table 10.2 to construct upper and lower control limits for both a mean chart and a range chart. Do the results suggest that the process is in control? Sample 1 Sample 2 Sample 3 Sample 4 Sample 5 10.2 10.3 9.7 9.9 9.8 9.9 9.8 9.9 10.3 10.2 9.8 9.9 9.9 10.1 10.3 10.1 10.4 10.1 10.5 9.7 40.0 40.4 39.6 40.8 40.0 Totals
1. Using the appropriate control chart, determine two-sigma control limits for each case: a. An inspector found an average of 3.9 scratches in the exterior paint of each of the automobiles being prepared for shipment to dealers. b. Before shipping lawn mowers to dealers, an inspector attempts to start each mower and notes any that do not start on the first try. The lot size is 100 mowers, and an average of 4 did not start (4 percent). 2. Checkout time at a supermarket is monitored using a mean and a range chart. Six samples of n = 20 observations have been obtained and the sample means and ranges computed: Sample Mean Range Sample Mean Range 1 3.06 .42 4 3.13 46 3.15 .50 3.06 46 3 3.11 .41 6. 3.09 .45 a. Using the factors in Table 4.2, determine upper and lower limits for mean and range charts. b. Is the process in control? 3. Processing new accounts at a bank is intended to average 10 minutes each. Five samples of four observations each have been taken. Use the sample data in conjunction with Table 10.2 to construct upper and lower control limits for both a mean chart and a range chart. Do the results suggest that the process is in control? Sample 1 Sample 2 Sample 3 Sample 4 Sample 5 10.2 10.3 9.7 9.9 9.8 9.9 9.8 9.9 10.3 10.2 9.8 9.9 9.9 10.1 10.3 10.1 10.4 10.1 10.5 9.7 40.0 40.4 39.6 40.8 40.0 Totals

Practical Management Science
6th Edition
ISBN:9781337406659
Author:WINSTON, Wayne L.
Publisher:WINSTON, Wayne L.
Chapter2: Introduction To Spreadsheet Modeling
Section: Chapter Questions
Problem 20P: Julie James is opening a lemonade stand. She believes the fixed cost per week of running the stand...

Related questions
Question
Answer number 1 only. Full solution. Unique answers only.
Transcribed Image Text:1. Using the appropriate control chart, determine two-sigma control limits for each case:
a. An inspector found an average of 3.9 scratches in the exterior paint of each of the
automobiles being prepared for shipment to dealers.
b. Before shipping lawn mowers to dealers, an inspector attempts to start each mower
and notes any that do not start on the first try. The lot size is 100 mowers, and an
average of 4 did not start (4 percent).
2. Checkout time at a supermarket is monitored using a mean and a range chart. Six
samples of n = 20 observations have been obtained and the sample means and ranges
computed:
Sample
Mean
Range
Sample
Mean
Range
1
3.06
.42
4.
3.13
46
3.15
.50
3.06
46
3.11
.41
3.09
45
a. Using the factors in Table 4.2, determine upper and lower limits for mean and range
charts.
b. Is the process in control?
3. Processing new accounts at a bank is intended to average 10 minutes each. Five samples
of four observations each have been taken. Use the sample data inń conjunction with
Table 10.2 to construct upper and lower control limits for both a mean chart and a range
chart. Do the results suggest that the process is in control?
Sample 1 Sample 2 Sample 3 Sample 4 Sample 5
9.8
10.2
10.3
9.7
9.9
9.9
9.8
9.9
10.3
10.2
9.8
9.9
9.9
10.1
10.3
10.1
10.4
10.1
10.5
9.7
40.4
39.6
40.8
40.0
40.0
Totals
Expert Solution
This question has been solved!
Explore an expertly crafted, step-by-step solution for a thorough understanding of key concepts.

This is a popular solution!

Trending now
This is a popular solution!

Step by step
Solved in 2 steps

Recommended textbooks for you
Practical Management Science
Operations Management
ISBN:
9781337406659
Author:
WINSTON, Wayne L.
Publisher:
Cengage,

Operations Management
Operations Management
ISBN:
9781259667473
Author:
William J Stevenson
Publisher:
McGraw-Hill Education

Operations and Supply Chain Management (Mcgraw-hi…
Operations Management
ISBN:
9781259666100
Author:
F. Robert Jacobs, Richard B Chase
Publisher:
McGraw-Hill Education
Practical Management Science
Operations Management
ISBN:
9781337406659
Author:
WINSTON, Wayne L.
Publisher:
Cengage,
Operations Management
Operations Management
ISBN:
9781259667473
Author:
William J Stevenson
Publisher:
McGraw-Hill Education
Operations and Supply Chain Management (Mcgraw-hi…
Operations Management
ISBN:
9781259666100
Author:
F. Robert Jacobs, Richard B Chase
Publisher:
McGraw-Hill Education


Purchasing and Supply Chain Management
Operations Management
ISBN:
9781285869681
Author:
Robert M. Monczka, Robert B. Handfield, Larry C. Giunipero, James L. Patterson
Publisher:
Cengage Learning

Production and Operations Analysis, Seventh Editi…
Operations Management
ISBN:
9781478623069
Author:
Steven Nahmias, Tava Lennon Olsen
Publisher:
Waveland Press, Inc.