1. What is the population of interest? 2. What claim is being made? 3. Specify the null and alternative hypothesis. Ho: Ha
1. What is the population of interest? 2. What claim is being made? 3. Specify the null and alternative hypothesis. Ho: Ha

Linear Algebra: A Modern Introduction
4th Edition
ISBN:9781285463247
Author:David Poole
Publisher:David Poole
Chapter7: Distance And Approximation
Section7.3: Least Squares Approximation
Problem 31EQ

Related questions
Topic Video
Question
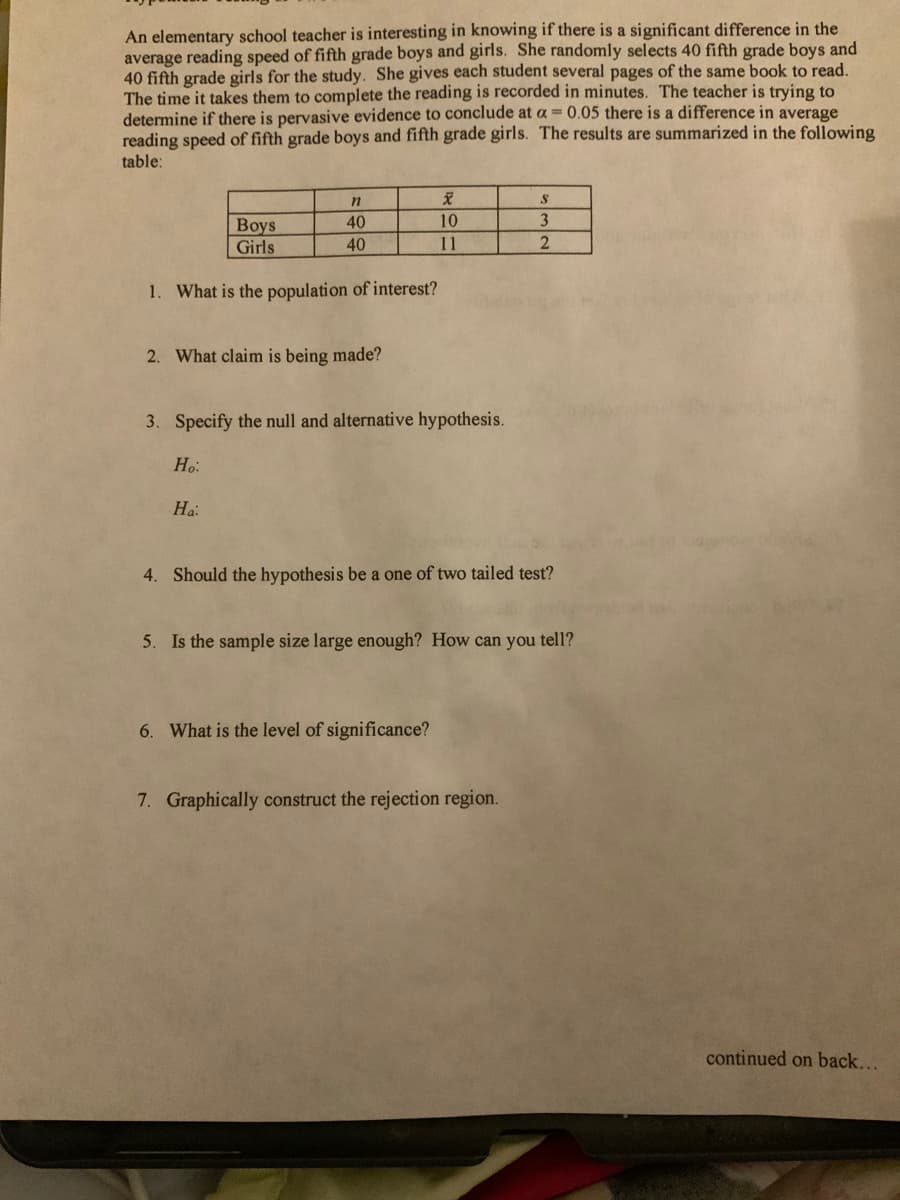
Transcribed Image Text:An elementary school teacher is interesting in knowing if there is a significant difference in the
average reading speed of fifth grade boys and girls. She randomly selects 40 fifth grade boys and
40 fifth grade girls for the study. She gives each student several pages of the same book to read.
The time it takes them to complete the reading is recorded in minutes. The teacher is trying to
determine if there is pervasive evidence to conclude at a = 0.05 there is a difference in average
reading speed of fifth grade boys and fifth grade girls. The results are summarized in the following
table:
40
10
Boys
Girls
40
11
1. What is the population of interest?
2. What claim is being made?
3. Specify the null and alternative hypothesis.
Ho:
Ha:
4. Should the hypothesis be a one of two tailed test?
5. Is the sample size large enough? How can you tell?
6. What is the level of significance?
7. Graphically construct the rejection region.
continued on back...
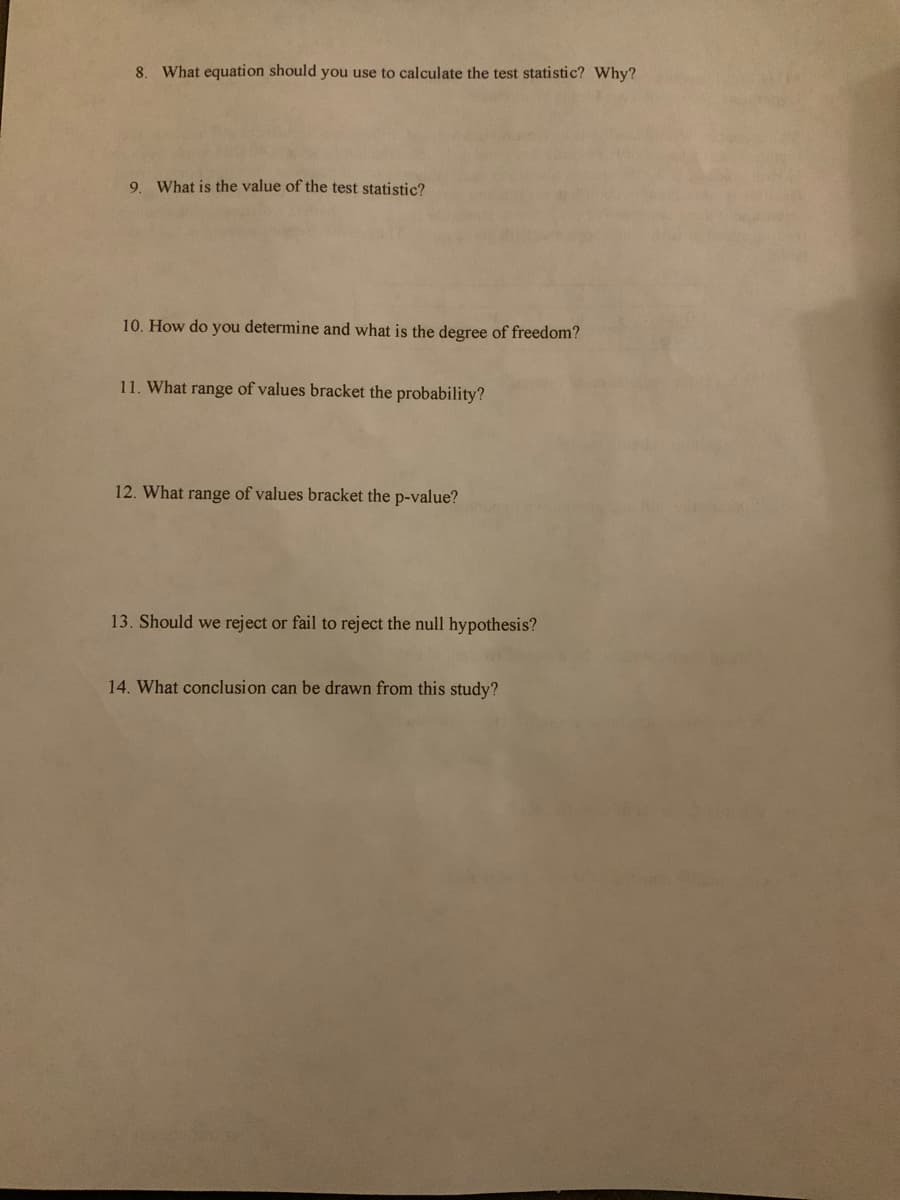
Transcribed Image Text:8. What equation should you use to calculate the test statistic? Why?
9. What is the value of the test statistic?
10. How do you determine and what is the degree of freedom?
11. What range of values bracket the probability?
12. What range of values bracket the p-value?
13. Should we reject or fail to reject the null hypothesis?
14. What conclusion can be drawn from this study?
Expert Solution
This question has been solved!
Explore an expertly crafted, step-by-step solution for a thorough understanding of key concepts.

Step by step
Solved in 3 steps with 1 images

Knowledge Booster


Learn more about
Need a deep-dive on the concept behind this application? Look no further. Learn more about this topic, statistics and related others by exploring similar questions and additional content below.Recommended textbooks for you
Linear Algebra: A Modern Introduction
Algebra
ISBN:
9781285463247
Author:
David Poole
Publisher:
Cengage Learning

Glencoe Algebra 1, Student Edition, 9780079039897…
Algebra
ISBN:
9780079039897
Author:
Carter
Publisher:
McGraw Hill
Linear Algebra: A Modern Introduction
Algebra
ISBN:
9781285463247
Author:
David Poole
Publisher:
Cengage Learning
Glencoe Algebra 1, Student Edition, 9780079039897…
Algebra
ISBN:
9780079039897
Author:
Carter
Publisher:
McGraw Hill