1.0+ 0.9+ 0.8+ 0.7- 0.6- 0.5+ 0.4+ 0.3- 0.2+ 0.1- 0.0- Survey Response Relative Frequency


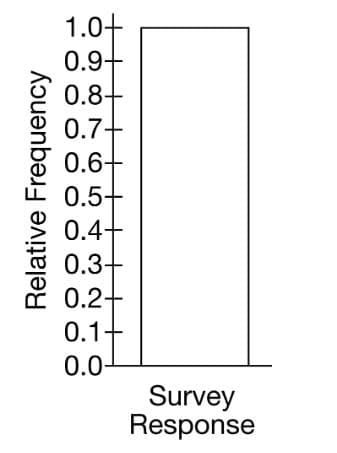
A survey was given to a random sample of 400 people living in a certain community. The people were asked whether they supported the construction of walking trails in the community park. The results are shown in the following table.
| Response | Frequency |
| Yes, support | 210 |
| No, do not support | 90 |
| No opinion | 100 |
| Total | 400 |
(a) Complete the following segmented bar chart to show the relative frequencies of the results.
A follow-up study will be conducted with a sample of 20 people from the 300 people who responded yes (support) and no (do not support). Two sampling methods have been proposed: a simple random sample and a stratified random sample with the survey response as strata.
(b) If the stratified random sample is used, what is the number of people that will be selected from those who responded yes? Support your answer by showing your work.


Trending now
This is a popular solution!

Step by step
Solved in 2 steps with 3 images


