1.06 $254,511,000 P239,957,000 Current Ratio 1.26 Current Assets 9248,357,000 Current Liabilities $196,719,000 Acid Ratio 0.76 0.87 Current Assets $254,511,000 9248,357,000 Inventory 972,056,000 P239,957,000 977,120,000 P196,719,000 Current Liabilities Asset Management Ratios Inventory Turnover Ratio Cost of Sales 3.60 $259,593,000 72,056,000 3.92 9302,612,000 77,120,000 Inventory 4.95% P377,149,000 976,222,000| Accounts Receivable Turnover Ratio 6.99% 9475,931,000 968,109,000 Net Sales Average Accounts Receivable 40.60% P377,149,000 9929,014,000 Fixed Assets Turnover Ratio 53.43% 9475,931,000 9890,766,000 Net Sales Average Fixed Assets
1.06 $254,511,000 P239,957,000 Current Ratio 1.26 Current Assets 9248,357,000 Current Liabilities $196,719,000 Acid Ratio 0.76 0.87 Current Assets $254,511,000 9248,357,000 Inventory 972,056,000 P239,957,000 977,120,000 P196,719,000 Current Liabilities Asset Management Ratios Inventory Turnover Ratio Cost of Sales 3.60 $259,593,000 72,056,000 3.92 9302,612,000 77,120,000 Inventory 4.95% P377,149,000 976,222,000| Accounts Receivable Turnover Ratio 6.99% 9475,931,000 968,109,000 Net Sales Average Accounts Receivable 40.60% P377,149,000 9929,014,000 Fixed Assets Turnover Ratio 53.43% 9475,931,000 9890,766,000 Net Sales Average Fixed Assets

Survey of Accounting (Accounting I)
8th Edition
ISBN:9781305961883
Author:Carl Warren
Publisher:Carl Warren
Chapter9: Metric-analysis Of Financial Statements
Section: Chapter Questions
Problem 9.4.10P: Twenty metrics of liquidity, solvency, and profitability The comparative financial statements of...

Related questions

Question
Analyze and explain the data presented.
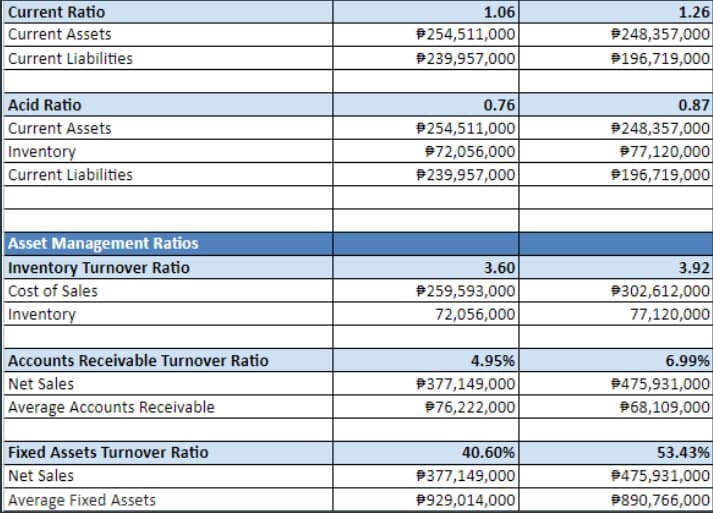
Transcribed Image Text:1.26
$248,357,000
P196,719,000
Current Ratio
1.06
254,511,000
P239,957,000
Current Assets
Current Liabilities
0.87
9248,357,000
977,120,000
$196,719,000
Acid Ratio
0.76
Current Assets
P254,511,000
972,056,000
P239,957,000
Inventory
Current Liabilities
Asset Management Ratios
Inventory Turnover Ratio
3.60
3.92
P259,593,000
$302,612,000
77,120,000
Cost of Sales
Inventory
72,056,000
Accounts Receivable Turnover Ratio
4.95%
P377,149,000
976,222,000
6.99%
9475,931,000
968,109,000
Net Sales
Average Accounts Receivable
40.60%
P377,149,000
53.43%
9475,931,000
P890,766,000
Fixed Assets Turnover Ratio
Net Sales
Average Fixed Assets
9929,014,000
Expert Solution
This question has been solved!
Explore an expertly crafted, step-by-step solution for a thorough understanding of key concepts.

This is a popular solution!

Trending now
This is a popular solution!

Step by step
Solved in 2 steps

Knowledge Booster


Learn more about
Need a deep-dive on the concept behind this application? Look no further. Learn more about this topic, accounting and related others by exploring similar questions and additional content below.Recommended textbooks for you
Survey of Accounting (Accounting I)
Accounting
ISBN:
9781305961883
Author:
Carl Warren
Publisher:
Cengage Learning
Survey of Accounting (Accounting I)
Accounting
ISBN:
9781305961883
Author:
Carl Warren
Publisher:
Cengage Learning