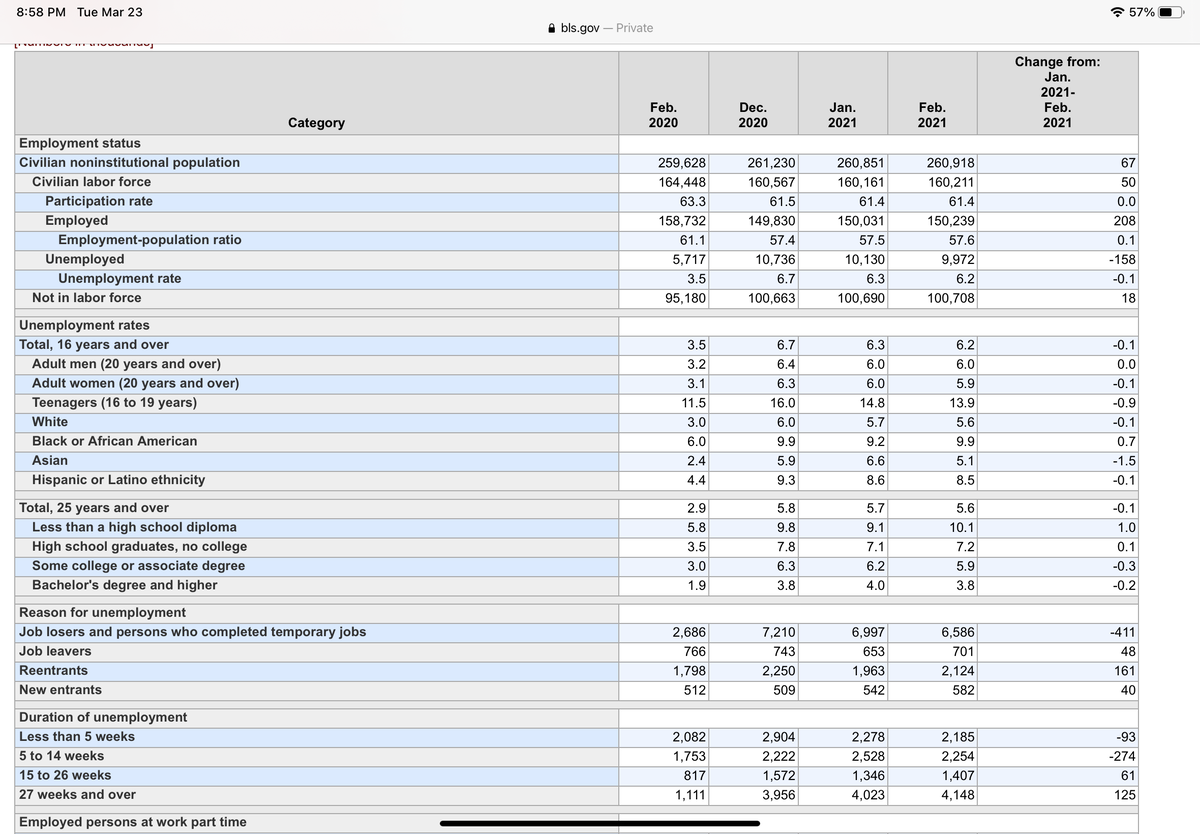
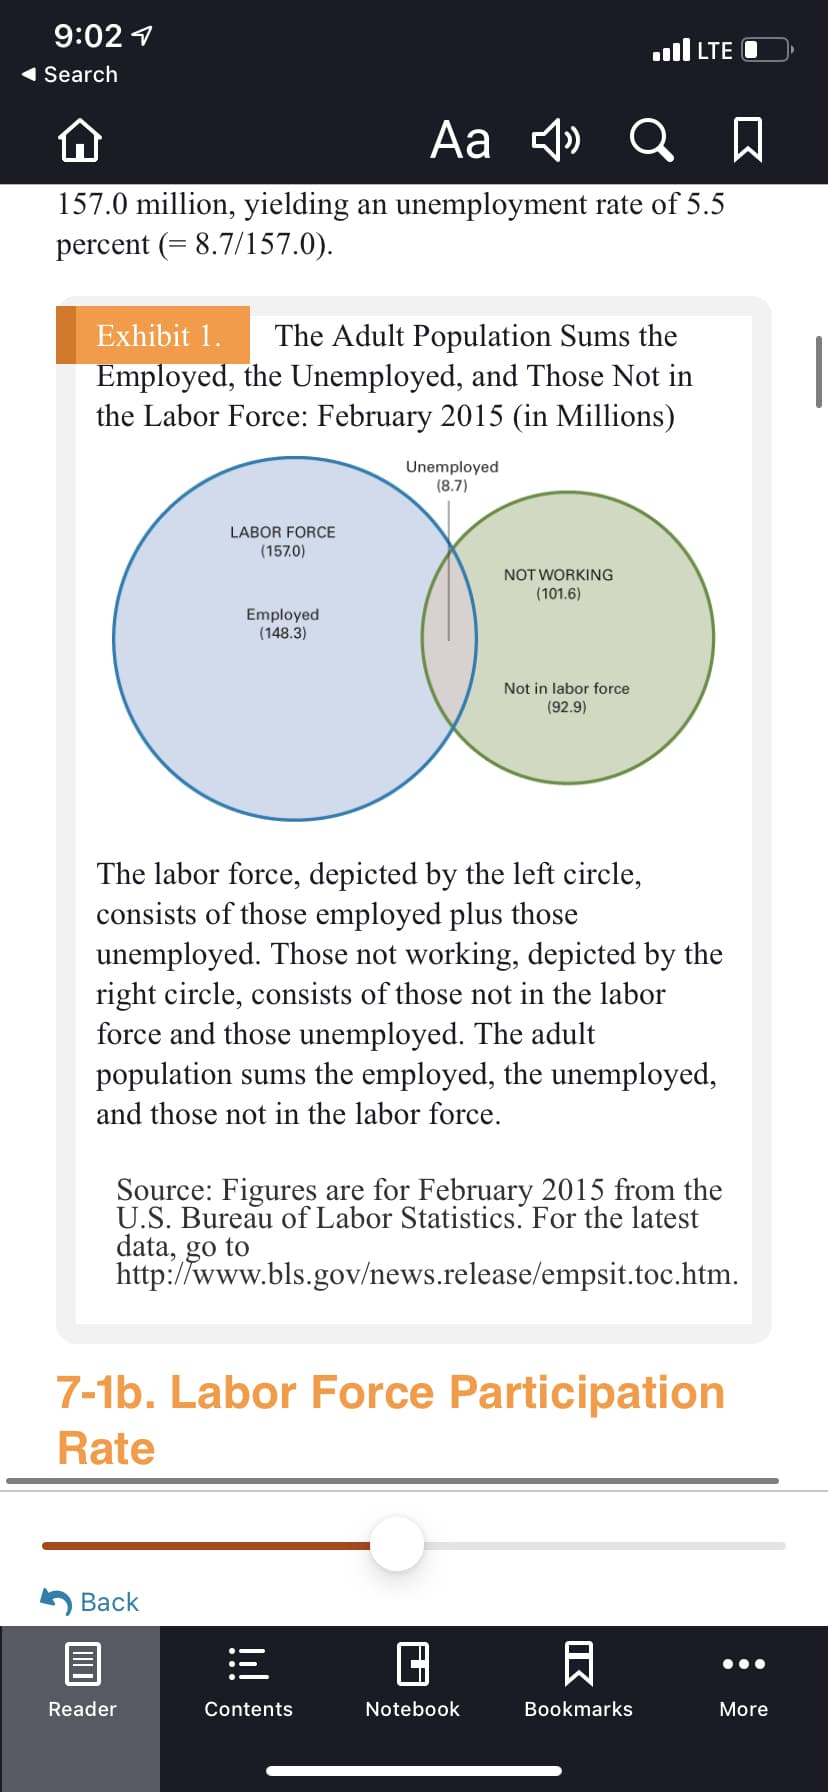
1.1Explain how the unemployment rate is calculated in the United States. Show how the most recent monthly unemployment rate is calculated using the Emplo
1.1Explain how the unemployment rate is calculated in the United States. Show how the most recent monthly unemployment rate is calculated using the Emplo
Micro Economics For Today
10th Edition
ISBN:9781337613064
Author:Tucker, Irvin B.
Publisher:Tucker, Irvin B.
Chapter12: Income Distribution, Poverty, And Discrimination
Section12.5: Discrimination
Problem 2.1YTE
Related questions
Question
1.1Explain how the
1.2 2) Calculate the percentage change in U.S. unemployment rate from February 2015 (recall this February2015 rate is contained in Exhibit 1 in chapter seven) to the most recent month contained in the Employment Situation Summary Table A. Household Data, seasonally adjusted table. Show your calculation and be clear what months of data you are using in your calculation.

Transcribed Image Text:8:58 PM Tue Mar 23
* 57%
A bls.gov – Private
Change from:
Jan.
2021-
Feb.
2021
Feb.
Dec.
Jan.
Feb.
Category
2020
2020
2021
2021
Employment status
Civilian noninstitutional population
259,628
261,230
260,851
260,918
67
Civilian labor force
164,448
160,567
160,161
160,211
50
Participation rate
63.3
61.5
61.4
61.4
0.0
Employed
158,732
149,830
150,031
150,239
208
Employment-population ratio
61.1
57.4
57.5
57.6
0.1
Unemployed
5,717
10,736
10,130
9,972
-158
Unemployment rate
3.5
6.7
6.3
6.2
-0.1
Not in labor force
95,180
100,663
100,690
100,708
18
Unemployment rates
Total, 16 years and over
3.5
6.7
6.3
6.2
-0.1
Adult men (20 years and over)
Adult women (20 years and over)
Teenagers (16 to 19 years)
3.2
6.4
6.0
6.0
0.0
3.1
6.3
6.0
5.9
-0.1
11.5
16.0
14.8
13.9
-0.9
White
3.0
6.0
5.7
5.6
-0.1
Black or African American
6.0
9.9
9.2
9.9
0.7
Asian
2.4
5.9
6.6
5.1
-1.5
Hispanic or Latino ethnicity
4.4
9.3
8.6
8.5
-0.1
Total, 25 years and over
2.9
5.8
5.7
5.6
-0.1
Less than a high school diploma
5.8
9.8
9.1
10.1
1.0
High school graduates, no college
3.5
7.8
7.1
7.2
0.1
Some college or associate degree
3.0
6.3
6.2
5.9
-0.3
Bachelor's degree and higher
1.9
3.8
4.0
3.8
-0.2
Reason for unemployment
Job losers and persons who completed temporary jobs
2,686
7,210
6,997
6,586
-411
Job leavers
766
743
653
701
48
Reentrants
1,798
2,250
1,963
2,124
161
New entrants
512
509
542
582
40
Duration of unemployment
Less than 5 weeks
2,082
2,904
2,278
2,185
-93
5 to 14 weeks
1,753
2,222
2,528
2,254
-274
15 to 26 weeks
817
1,572
1,346
1,407
61
27 weeks and over
1,111
3,956
4,023
4,148
125
Employed persons at work part time
LO
53.

Transcribed Image Text:9:02 1
ull LTE O
1 Search
Aa <» Q A
157.0 million, yielding an unemployment rate of 5.5
percent (= 8.7/157.0).
The Adult Population Sums the
Employed, the Unemployed, and Those Not in
the Labor Force: February 2015 (in Millions)
Exhibit 1.
Unemployed
(8.7)
LABOR FORCE
(157.0)
NOT WORKING
(101.6)
Employed
(148.3)
Not in labor force
(92.9)
The labor force, depicted by the left circle,
consists of those employed plus those
unemployed. Those not working, depicted by the
right circle, consists of those not in the labor
force and those unemployed. The adult
population sums the employed, the unemployed,
and those not in the labor force.
Source: Figures are for February 2015 from the
U.S. Bureau of Labor Statistics. For the latest
data, go to
http://www.bls.gov/news.release/empsit.toc.htm.
7-1b. Labor Force Participation
Rate
Вack
Reader
Contents
Notebook
Bookmarks
More
IK
!
Expert Solution
This question has been solved!
Explore an expertly crafted, step-by-step solution for a thorough understanding of key concepts.
This is a popular solution!
Trending now
This is a popular solution!
Step by step
Solved in 2 steps

Knowledge Booster
Learn more about
Need a deep-dive on the concept behind this application? Look no further. Learn more about this topic, economics and related others by exploring similar questions and additional content below.Recommended textbooks for you


Principles of Economics 2e
Economics
ISBN:
9781947172364
Author:
Steven A. Greenlaw; David Shapiro
Publisher:
OpenStax


Principles of Economics 2e
Economics
ISBN:
9781947172364
Author:
Steven A. Greenlaw; David Shapiro
Publisher:
OpenStax