1.4 The economic problem arises from the coexistence of A. limited wants and unlimited resources. B. unlimited wants and limited money in circulation. C. limited wants and limited resources. D. unlimited wants and unlimited resources. E. unlimited wants and limited resources. 1.5 The shape of the PPC curve is A. downwards sloping from left to right. B. kinked as soon as the costs of factors of production are equal. C. bulging inwards towards the origin. D. horizontal as the consumer has a choice between two normal goods. E. bulging outwards from the origin.
1.4 The economic problem arises from the coexistence of A. limited wants and unlimited resources. B. unlimited wants and limited money in circulation. C. limited wants and limited resources. D. unlimited wants and unlimited resources. E. unlimited wants and limited resources. 1.5 The shape of the PPC curve is A. downwards sloping from left to right. B. kinked as soon as the costs of factors of production are equal. C. bulging inwards towards the origin. D. horizontal as the consumer has a choice between two normal goods. E. bulging outwards from the origin.

Essentials of Economics (MindTap Course List)
8th Edition
ISBN:9781337091992
Author:N. Gregory Mankiw
Publisher:N. Gregory Mankiw
Chapter3: Interdependence And The Gains From Trade
Section: Chapter Questions
Problem 8PA

Related questions
Question
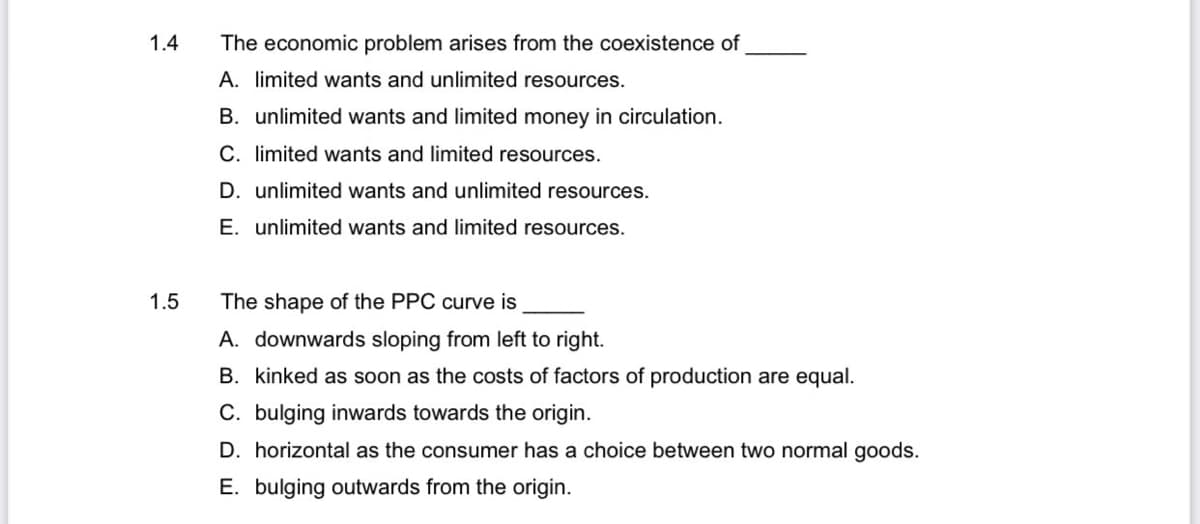
Transcribed Image Text:1.4
The economic problem arises from the coexistence of
A. limited wants and unlimited resources.
B. unlimited wants and limited money in circulation.
C. limited wants and limited resources.
D. unlimited wants and unlimited resources.
E. unlimited wants and limited resources.
1.5
The shape of the PPC curve is
A. downwards sloping from left to right.
B. kinked as soon as the costs of factors of production are equal.
C. bulging inwards towards the origin.
D. horizontal as the consumer has a choice between two normal goods.
E. bulging outwards from the origin.
Expert Solution
This question has been solved!
Explore an expertly crafted, step-by-step solution for a thorough understanding of key concepts.

This is a popular solution!

Trending now
This is a popular solution!

Step by step
Solved in 2 steps

Knowledge Booster


Learn more about
Need a deep-dive on the concept behind this application? Look no further. Learn more about this topic, economics and related others by exploring similar questions and additional content below.Recommended textbooks for you
Essentials of Economics (MindTap Course List)
Economics
ISBN:
9781337091992
Author:
N. Gregory Mankiw
Publisher:
Cengage Learning

Brief Principles of Macroeconomics (MindTap Cours…
Economics
ISBN:
9781337091985
Author:
N. Gregory Mankiw
Publisher:
Cengage Learning
Essentials of Economics (MindTap Course List)
Economics
ISBN:
9781337091992
Author:
N. Gregory Mankiw
Publisher:
Cengage Learning
Brief Principles of Macroeconomics (MindTap Cours…
Economics
ISBN:
9781337091985
Author:
N. Gregory Mankiw
Publisher:
Cengage Learning