10 15 20 25 30 Above is a graph of sample means of the sum of five dice. The sample size was fifty, and the process was repeated 100,000 times. According to the Central Limit Theorem, what is the population mean sum? O5 O 17.5
10 15 20 25 30 Above is a graph of sample means of the sum of five dice. The sample size was fifty, and the process was repeated 100,000 times. According to the Central Limit Theorem, what is the population mean sum? O5 O 17.5

Holt Mcdougal Larson Pre-algebra: Student Edition 2012
1st Edition
ISBN:9780547587776
Author:HOLT MCDOUGAL
Publisher:HOLT MCDOUGAL
Chapter11: Data Analysis And Probability
Section: Chapter Questions
Problem 6CST

Related questions
Question
Transcribed Image Text:10
15
20
25
30
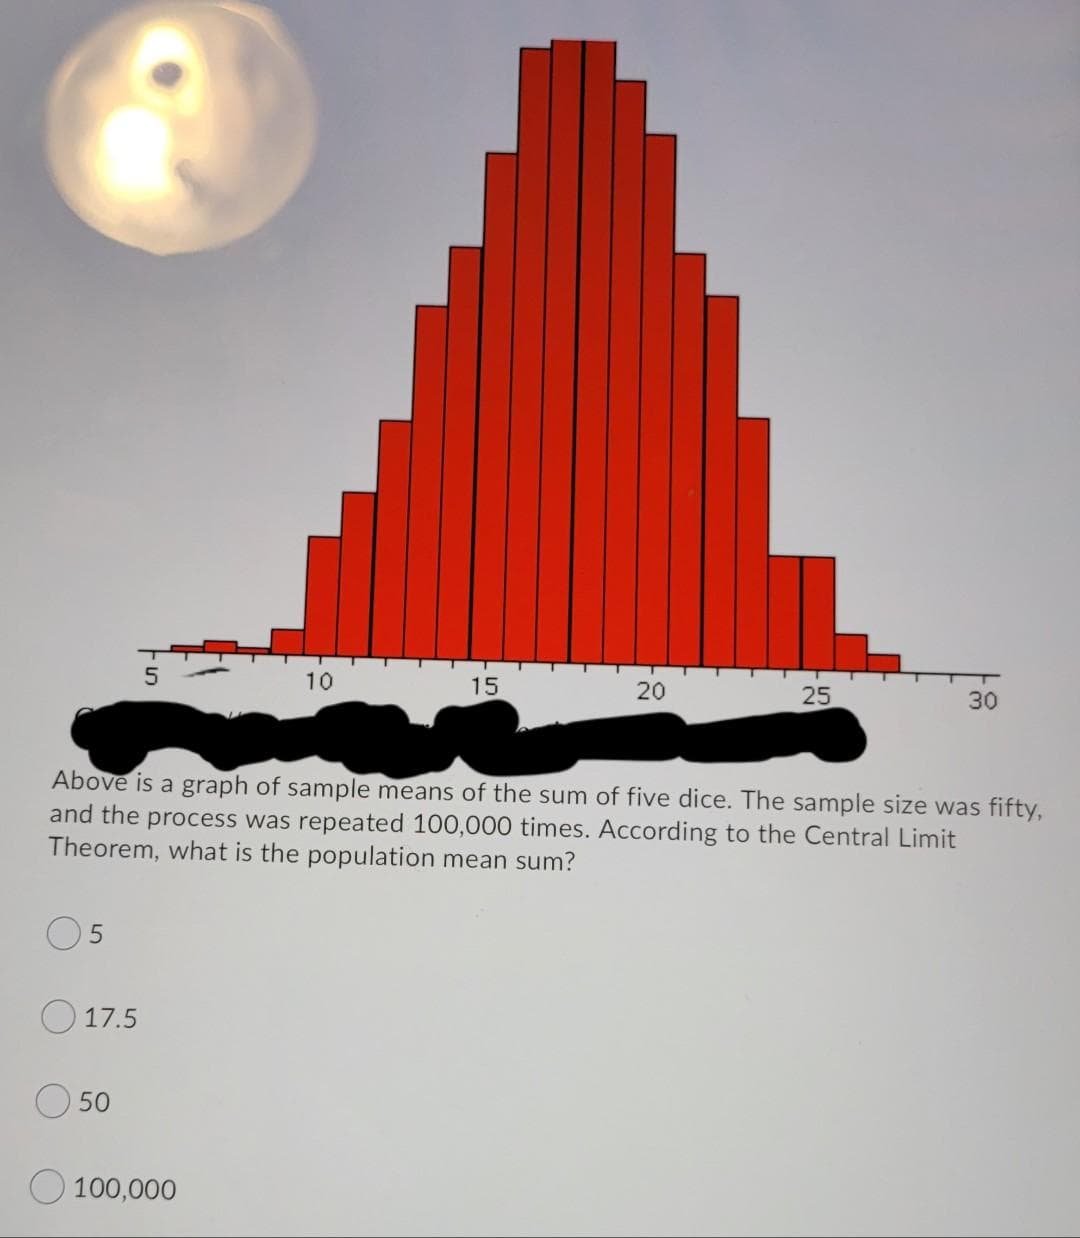
Above is a graph of sample means of the sum of five dice. The sample size was fifty,
and the process was repeated 100,000 times. According to the Central Limit
Theorem, what is the population mean sum?
17.5
O 50
O 100,000
Expert Solution
This question has been solved!
Explore an expertly crafted, step-by-step solution for a thorough understanding of key concepts.

This is a popular solution!

Trending now
This is a popular solution!

Step by step
Solved in 2 steps

Recommended textbooks for you
Holt Mcdougal Larson Pre-algebra: Student Edition…
Algebra
ISBN:
9780547587776
Author:
HOLT MCDOUGAL
Publisher:
HOLT MCDOUGAL

Holt Mcdougal Larson Pre-algebra: Student Edition…
Algebra
ISBN:
9780547587776
Author:
HOLT MCDOUGAL
Publisher:
HOLT MCDOUGAL