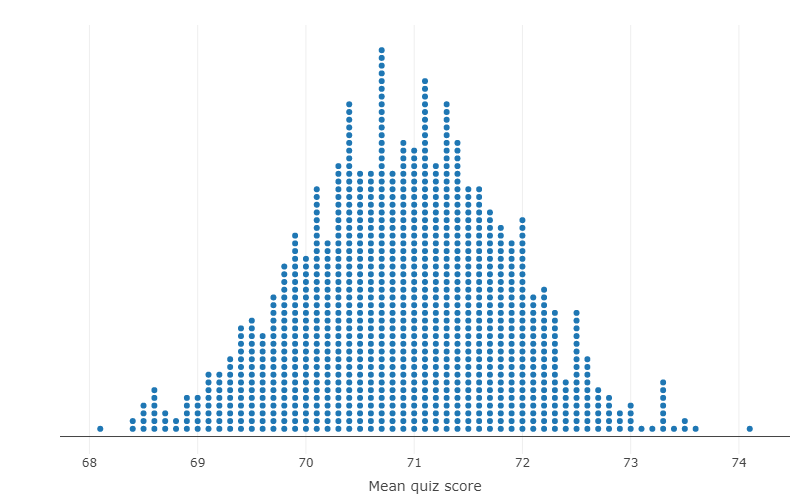
A sampling distribution (dotplot) for the mean quiz score for a sample n = 30 of STAT101 students is shown below. It was constructed using random samples from population data. If we take a random sample of 30 STAT101 students and calculate its sample mean, approximately what is the chance that we will see a sample mean above 74? (Hint: there are 1000 sample statistics represented in the dotplot.)
A sampling distribution (dotplot) for the mean quiz score for a sample n = 30 of STAT101 students is shown below. It was constructed using random samples from population data. If we take a random sample of 30 STAT101 students and calculate its sample mean, approximately what is the chance that we will see a sample mean above 74? (Hint: there are 1000 sample statistics represented in the dotplot.)

Algebra & Trigonometry with Analytic Geometry
13th Edition
ISBN:9781133382119
Author:Swokowski
Publisher:Swokowski
Chapter10: Sequences, Series, And Probability
Section10.8: Probability
Problem 30E

Related questions
Question
A sampling distribution (dotplot) for the
If we take a random sample of 30 STAT101 students and calculate its sample mean, approximately what is the chance that we will see a sample mean above 74? (Hint: there are 1000 sample statistics represented in the dotplot.)
Transcribed Image Text:.…......
……………….
......
……………………….
…………………………
...
…....
...
0.00
.....
…………….
....
●●
74
73
72
Mean quiz score
71
70
69
89
Expert Solution
This question has been solved!
Explore an expertly crafted, step-by-step solution for a thorough understanding of key concepts.

Step by step
Solved in 2 steps with 1 images

Recommended textbooks for you
Algebra & Trigonometry with Analytic Geometry
Algebra
ISBN:
9781133382119
Author:
Swokowski
Publisher:
Cengage

Algebra & Trigonometry with Analytic Geometry
Algebra
ISBN:
9781133382119
Author:
Swokowski
Publisher:
Cengage