10. Avelocity-time graph for an object moving along the x axis is shown in the figure below. a) Plot a graph of the acceleration versus time. b) Determine the average velocity of the object in the time interval t = 5.00 s to t = 10.0 s c) Determine the average velocity of the object in the time interval t = 10 tot = 155 d) Determine the average velocity of the object in the time interval t = 0 tot = 20s v (m/s)
10. Avelocity-time graph for an object moving along the x axis is shown in the figure below. a) Plot a graph of the acceleration versus time. b) Determine the average velocity of the object in the time interval t = 5.00 s to t = 10.0 s c) Determine the average velocity of the object in the time interval t = 10 tot = 155 d) Determine the average velocity of the object in the time interval t = 0 tot = 20s v (m/s)

Related questions
Question
can anyone solve this please
thanks
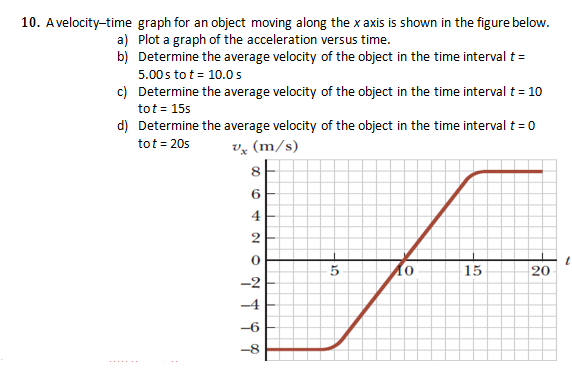
Transcribed Image Text:10. Avelocity-time graph for an object moving along the x axis is shown in the figure below.
a) Plot a graph of the acceleration versus time.
b) Determine the average velocity of the object in the time interval t =
5.00 s to t = 10.0 s
c) Determine the average velocity of the object in the time interval t = 10
tot = 155
d) Determine the average velocity of the object in the time interval t = 0
tot = 20s
vz (m/s)
6.
4
2
5
15
20
-2
-4
-6
-8
Expert Solution
This question has been solved!
Explore an expertly crafted, step-by-step solution for a thorough understanding of key concepts.

Step by step
Solved in 3 steps with 1 images
