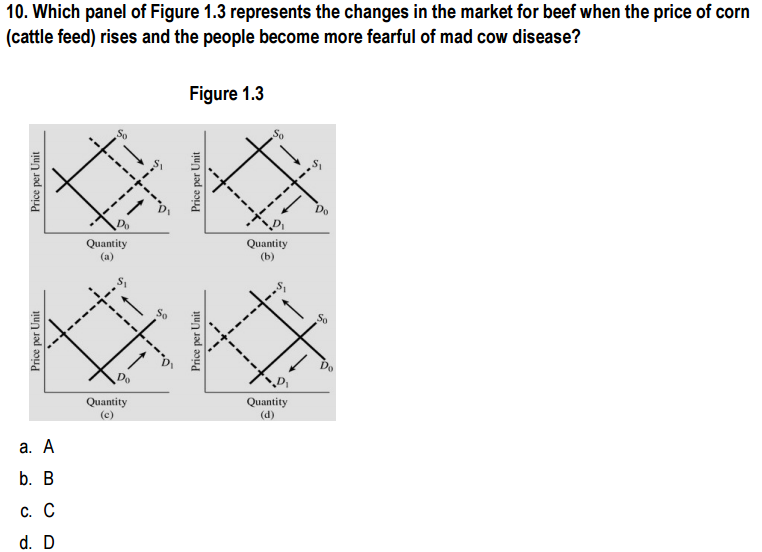
10. Which panel of Figure 1.3 represents the changes in the market for beef when the price of corn (cattle feed) rises and the people become more fearful of mad cow disease? Figure 1.3 Quantity (b) Quantity (a) So So Quantity (d) Quantity (c) а. А b. В с. С d. D Price per Unit Price per Unit Price per Unit Price per Unit


Q: Use the table below to choose the correct answer. The table is a schedule of the supply and demand…
A: Demand: - Demand is the relationship between the quantity demanded and the price of a good. There is…
Q: Suppose Hubert is the only seller in the market for bottled water and Clancy 19 Lie bottle of water…
A: Consumer surplus, the sum that purchasers will pay for a decent short the sum they really pay for…
Q: g equations: P = 48 – 2Q P = 24 + 2Q demand: supply: is the price of a bushel in dollars and Q is…
A: At equilibrium, demand = supply and graphically where demand & supply intersect or cross each…
Q: Figure 1 2- a) What are the equilibrium price and equilibrium quantity in the market illustrated by…
A: Equilibrium is at intersection of demand and supply curves. If actual price > equilibrium price,…
Q: 4. Suppose demand and supply for eggs are given by the following equation: Qd = 100-20P Qs = 10 at…
A: Given; Qd=100-2PQs=10+40Pwhere;Qd=number of eggs purchased yearlyQs=number of eggs farms would sell…
Q: What would happen to the equilibrium price and quantity in the market for oak tables if the price of…
A: As per the guidelines, we are allowed to answer just first question. Please, post the remaining…
Q: What would happen to the equilibrium price and quantity in the market for oak tables if the price of…
A: When the price of maple tables rises , the price of oak wood rises and more buyers would enter the…
Q: Use the figure below to answer the following question. $5 S3 S2 2 4 6 8 10 12 14 16 18 20 Quantity…
A: The supply of corn to shift from s1 to s2 is based on the increasing or decreasing factors affecting…
Q: In the market for newspapers in your town the salaries of journalists go up and there is a big news…
A: Journalists are an input in the production of newspapers; their salary will increase will cause the…
Q: Assume that the graphs show a competitive market for the product stated in the question. Price Price…
A: The destroy of the crop decreases the crop available in the market and does not change the demand…
Q: The table below displays hypothetical demand and supply schedules for the market for Tables in…
A: Hi, thank you for the question. As pr the Honor code, we are allowed to attempt only first three…
Q: C. Solve for the market equilibrium price (P) and market equilibrium quantity (Q) Answer must be in…
A: Equilibrium price is the price at which quantity demanded equals quantity supplied and the market…
Q: V. Suppose that cheap cloth is imported from China for production of readymade garments and at the…
A: Answer - Given in the question - Suppose that cheap cloth is imported from China for production of…
Q: Which of the following occurs when an excess demand occurs in the market for a good? O Quantity…
A: Answer to the question is as follows:
Q: Suppose ManTown demand and supply curves for oil is given by ? = 500−4? ? = −100+6? a)…
A: Since you have posted multiple parts question, we will solve the first three parts for you. If you…
Q: . Consider a competitive market for apartments in Bandung. What is the effect on the equilibrium…
A: New development of technology leads to a cut in the cost of apartment which will make the supply…
Q: 1. Consider the following demand and supply model of the world tea market (in billions of pounds)…
A: Note: We’ll answer the first question since the exact one wasn’t specified. Please submit a new…
Q: Question 2 This diagram shows the market for cocoa. Equilibrium is currently at point x The market…
A: Speculation of future prices is one of the factors that can cause changes in the current demand for…
Q: 2. By effective demand, we mean: (a) Both ability and willingness to buy a commodity (b) Willingness…
A: # Demand is referred to be as the requirement or desire of a good or service.
Q: 10) Suppose the price of X rises by 20 % on January 10, 2021 and that by March 10, 2021 the quantity…
A: Solution: Suppose the price of X rises by 20 % on January 10, 2021 and that by March 10, 2021 the…
Q: Suppose that the price of basketball tickets at your college is determined by market forces.…
A: Disclaimer = As you posted multipart questions we are supposed to solve only the first 3quesions .…
Q: Assume that the markets for sugar cane, rum, and whiskey are initially in equilibrium (i.e., supply…
A: ANSWER STEP-1 With good harvest, the supply of sugar cane will increase:- Sugar cane market: Due to…
Q: What if the information regarding market demand and market supply is conveyed in equations rather…
A: Demand curve shows different combinations of price and quantity demanded and supply curve shows…
Q: Which of the following best refers to the market equilibrium price? O The quantity demanded is the…
A: The situation in which the economic forces of demand and supply tend to be balanced in nature is…
Q: 13. Now in the market equilibrium, define equilibrium price and quantity. With demand and supply in…
A: 13. With demand and supply in the market, we can now understand how the decisions of both buyers and…
Q: What will happen to the equilibrium price and quantity of pens if the price of pencils rises,…
A: Equilibrium Price and Quantity is affected by changes in demand and supply. At equilibrium price,…
Q: The government offers subsidies to homeowners for the purchase and installation of solar energy…
A: Equilibrium in the market occurs where quantity demanded equals quantity supplied, that is at the…
Q: 2. Consider the demand and supply functions Qs = -400 + 20P Qd = 1,400 – 10P (Qd and Qs are in unit…
A: Answer: Supply Function: ,Qs=-400+20P suppose the supply equation is Qs=c+dP The 'c' variable…
Q: because gas would have been affordable. p. $ per gallon· O E. resulted in a shortage because…
A: The equilibrium is achieved at intersection of demand and supply curve. As the hurricane Katrina…
Q: c. Calculate equilibrium price and equilibrium quantity and fill the following column Qs = -400 +…
A: C)
Q: A large disruption in the world oil supply increases the price of oil for a long while. What will…
A: The curve that depicts quantities of goods and services being supplied by producers at various…
Q: Suppose the total demand for wheat and the total supply of wheat per month in the Kansas City grain…
A: A theory that illustrates the interaction between the buyers and the sellers of a resource is known…
Q: 1. Plot the graph of the demand and supply schedule below, determine the equilibrium quantity and…
A: Equilibrium occurs when the quantity supplied is the same as the quantity demanded. If the quantity…
Q: Use the following table to answer the next five questions. Market for Corn Year Price Quantity…
A: Equilibrium Price: It is the price at which Quantity Demanded for a good is equal to the Quantity…
Q: Suppose that in the rice market demand shifts greatly due to a new rice diet that is being marketed…
A: Before the Shifting in the both curves, the equilibrium is obtained at point E1, where supply curve…
Q: Price (dollars per gallon of ice cream) 20 18 16 So 14 12 10 8 50 100 150 200 250 300 350 Quantity…
A: please find the answer below.
Q: 37. If commodity Mis an inferior good, which of the following must be true? a. The demand curve for…
A: The ratio of the change in the percentage of the quantity demanded and the change in the percentage…
Q: 7. If the demand and supply curve for computers is: D = 100 - 6P, S = 28 + 3P %3D Where P is the…
A: Given, D = 100 - 6P S = 28 + 3P
Q: Note: Once you enter a value in a white field, the graph and any corresponding amounts in each grey…
A: The market equilibrium occurs at a point where demand and supply curves intersect.
Q: For question 3, 4, and 5, use the table below for the Demand and Supply of Widgets Price Quantity…
A: In the given table, quantity demanded and quantity supplied of widget at different price level is…
Q: Researchers demonstrate conclusively that drinking 4-6 ounces of beer each day increases life…
A: When there is a change in price of good, it causes movement along the demand curve or supply curve.…
Q: 1. Plot the graph of the demand and supply schedule below, determine the equilibrium quantity and…
A: The equilibrium quantity and price can be determined at the point of intersection of the demand and…


Trending now
This is a popular solution!

Step by step
Solved in 2 steps with 1 images


- 15. Refer to Figure 4-8. All else equal, an increase in the income of buyers who consider turkey to be an inferior good would cause a move from a. Da to Db. b. Db to Da. c. x to y. d. y to x.16. Consider a market in which high-quality and low-quality television sets are sold. Before consumers make a purchase, they do not know the quality of the sets , but the sellers do know . As compared to a situation where both consumers and sellers know the quality of the sets, this situation would ) A)cause no change in the ratio of low to high-quality sets sold B)increase the fraction of high-quality sets sold (C) increase the fraction of low-quality sets sold (D) cause the average price of goods sold to rise.Qd = β0 +β1Psh +β2M+β3Pcg+β4Ax+ β5C Where, Qd = Quantity demand for a deluxe room in sh Psh = Price of a deluxe room in sh (US$/room) = US$. 200.00 M = Visitors per capita income (US$/Day) = US$ 120 Pcg = Price of a deluxe room in CG (US$/room) = US$. 150.00 Ax = Average advertising expenditure in sh (US$/room) US$. 18.00 C = Customer Satisfaction Index = 8.56 DV: Q R- Square: 0.86 T table value 1.671 No of obse: 62 F- Ratio: 154.15 Var Para Esti SE β0 127.8 49.6 β1 -1.3.0 0.42 β2 2.75 1.01 β3 2.55 1.21 β4 1.41 0.48 β5 1.85 0.23 a) Are estimated parameters comparable with economic theory? why ,What are the significant parameters that could be impact on the demand for a deluxe room b) Construct the Total Revenue (TR) function of Sh hotel and determine the TR maximize demand c) Calculate and interpret, cross-price elasticity, income elasticity, and advertising elasticity of demand for a deluxe room and Calculate Adjusted R2 and interpret it.
- Suppose that the demand and supply schedules for raisins in South Carolina are as fallows, quantitiesare measured in millions of packs per month. What is the quantity of raisins bought if the price is 50cents ? Price (cents per pack) Quantity demanded20 18030 16040 14050 12060 10070 8080 60 a) 120b) 180c) 100[MUST SHOW WORK] Consider the above table for the market for oranges. A deep frost destroys many or the orange juice businesses to go put of business. As a result, quantity supplied decreases hper kg and the new equilibrium quantiy is.........? kg of oranges The new equilibrium price is .............? kg of oranges Select one: O A. 1.70;400 O B. 1.10; 700 O C. 1.20;650 O D. 0.90;400 O E. 1.50;500Time remaining:00 :09 :39EconomicsUse the following to answer questions (29) - (31):In the town of “One Horse” there is one movie theater. Two groups of consumers, adults (A) andchildren (C), attend this theater. Suppose the demand for movies by adults is given by:QA = 50 - 0.50PA, where PAis price ofan adultmovie ticket(in cents)and QAis the numberofmovie tickets sold to adults atthe theater. Suppose the demand for movies by children is given by:QC = 20 - 0.50PC,where PCispriceofa children’s movie ticket(in cents)and QCis the numberofmovie tickets sold tochildren atthe theater. Also, imagine totalcostis fixed at$450, thus makingmarginalcostofprovidingonemore movie ticket to either an adult or a child constant at zero.[29]Ifthe movie theateris able to price discriminate amongits two groups ofconsumers, then itshouldcharge a higher price to group A.A.TrueB.False[30]Ifthemovie theateris able to price discriminate amongits two groups ofconsumers, then itsmaximum profit is closest in value…
- Suppose that you have information indicating that the price of steel (an important input ofproduction in the auto industry) has doubled during the past few months. Show howthis economicshock will influence the market for American made cars and give your predictions for equilibriumprice and sales change.Q1 new technology introduced which reduces cost pf producing of hybrid cars graph pre market equilibrium aand post market equilibrium. Q 2 importance of elasticity in decision makingfor consumers and producers, explain your concept byplotting separate graphsA real estate developer is offering identical houses for sale for $350,000 each, and has 20 willing customers. The developer is considering lowering the price to $300,000, since at that price there would be an additional 3 customers willing to purchase houses. What would be the developer’s change in revenue from lowering the price in this way? A)-$100,000 B) $100,000 C) $900,000
- A. Diagram 1- Which of the following area (A-F, select 1), represents the additional surplus fromnew consumers as a results of pricedecreasing from P1 to P2? B. Diagram 1- Which of the following area (A-F, select 1), represents the additional surplus fromthe original consumers as a results of price decreasing from P1 to P2?04. Assuming this market is at equilibrium, what is the "consumer's surplus"? a) $16 b) $72 c) $32 d) $12 e) $6Q)Assume standard downward sloping demand for subways rides. At a per-trip price of $4,you take 30 trips per month. Alternatively, you can purchase a monthly pass whose price is $120for unlimited rides. If you purchased the monthly pass, you _____ consumer surplus as if youpaid $4 per ride and you would take _____ trips.A. get the same; the same number of.B. get the same; more.C. get more; more.D. get more; the same number of.E. might get more or less; the same number of.