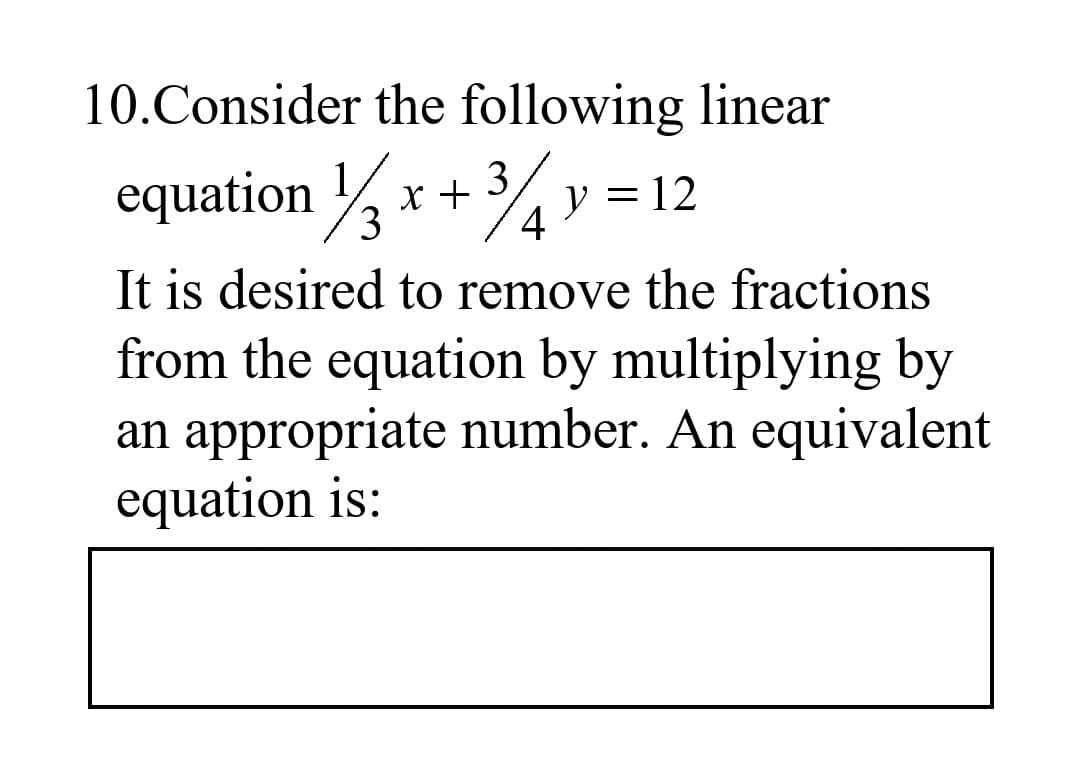
10.Consider the following linear equation x + % 1. 3. = 12 It is desired to remove the fractions from the equation by multiplying by an appropriate number. An equivalent equation is:
Q: The table below shows the amount, y, remaining on a bus pass after x rides. Number of rides, x 048…
A:
Q: Consider the supply equation: P = 7+ 2Q? By evaluating the price elasticity of supply at the point P…
A:
Q: A company would like to predict their monthly sales (Y) by using advertising expenditure (X1) and…
A:
Q: These are the same data as in the previous question. Find the value of b2. You should use a computer…
A:
Q: 15 The cost of ordering movie tickets online is $15.50 per ticket plus a fee of $2.25 per…
A:
Q: A fast food company knows that the sales results of its products are closely related to the average…
A: Given, the sales results of products are closely related to the average income level of the…
Q: 4. Which equation represents the data in the table? (TEK 8.51) y 13 4 2 1 -2 -5 A. y 3x + 1 C. y =…
A: The answer is found in step-2.
Q: English Spanish O y = 3x + 4 10 7. o y= {x+ 4 6. 4 3. 2. Oy = 4x + 1. 1 2 3 4 5. 7. 8. 6. 6. 10 Next…
A:
Q: If a trip took 4 days, the predicted cost of the trip is
A: The model is given by y = $400 + 120x Where y is cost of travel And x is number of days spent on…
Q: A chemistry student heats a beaker that is at room temperature (30 ° C)by inserting it in an oven…
A:
Q: The scatterplot shows the relationship between Marvin's age and the time it took him to run a mile.…
A: To determine the correct option.
Q: 12. Write the equation that represents the relationship between x and y. -4 -1 13 16 16 13 -1 -4
A: Given: x -4 -1 13 16 y 16 13 -1 -4
Q: A farmer notices that there is a linear relationship between the number of bean stalks, n, she…
A:
Q: 2. Given the following 2 table of values, determine which one is linear and which one is…
A: Since there are multiple questions present, according to company policy we will be answering only…
Q: Which of the following equations represents the data in the table? -4 4 8. -1 -4 3. y -x+2 C. 3…
A:
Q: Q4. Dr. Ahmad has noticed many of his students have been absent from class this semester. He feels…
A: As per our guidelines, we have provided answer for first 3 sub-parts. Please repost the other parts
Q: During a period of decline in stock market prices a stock sold at $. 50 per share on one day $. 40…
A: Given that : Stock price on 1st day = $50 Stock price on 2nd day = $40…
Q: 2. The relationship between the air temperature T (in degrees Fahrenheit) and the altitude h (in…
A: The temperature between the air temperature (in oF) and the altitude (h)(in feet above sea level)…
Q: 7. The scatterplot below could show the relationship between which two variables? A. The speed of an…
A: The given graph shows the negative correlation.
Q: A linear relationship exists between the quantities whose values are represented by the variables s…
A: given,
Q: 4. 3 2. Write an equation of the line below. 1234 56 7 8 E t S 9-- 8-
A:
Q: A regression analysis between sales (in $1000) and price (in dollars) resulted in the following…
A: In the regression equation Y=58-15X, the response variable is sales which is represented by Y and…
Q: Example 8. If a relationship between x and y is given by : 2x + 3y = 10 and M.D. of x is 15, what is…
A:
Q: 3) Please answer the question and show your work in the space provided. The scatterplot below shows…
A: The question is based on a residual Given reg. eq : y = 6.642 + 0.03974x where, y : expected…
Q: A clothing business finds there is a linear relationship between the number of shirts, n (in…
A: Given, 3000 shirts can be sold at a price of $69 each, and that 7000 shirts can be sold at a price…
Q: If G =-10e2 and y(0) = 20, what is the value of y(6)? 1. dt (А) 20е 6 (В) 20е-3 (C) 20e-2 (D) 10e-3…
A:
Q: With a trend line equation of y = -0.669x + 101.09, modify the table below showing the values as…
A:
Q: 2) Determine if the following relationship is linear, exponential, or neither: y 1 8 2 11 3 14
A:
Q: Zach plotted 10 points on a scatter plot to investigate the relationship between two quantitative…
A: Definition: A line of best fit is a straight line that best represents the data on a scatter plot.…
Q: There's a roughly linear relationship between the length of someone's femur (the long leg-bone in…
A: We have to emphasise the significance of 2.5 in the above equation.
Q: Which table contains only values that satisfy the equation y = 4x + 1? 6. 4 27 35 8. 43 A. 6. 17 25…
A:
Q: Sacred Heart’s yearbook committee is comparing prices from two different companies to print this…
A: given that Company A: charges $5 000 for set up plus $4 per copy.Company B: charges $14 per copy…
Q: 3. Which table contains only values that satisfy the equation y = 1.5x + 4 A. B. C. D. y y y y 4. 4…
A: Given , equation y = 1.5x + 4 We have to find table contains only values that satisfy the equation…
Q: Suppose the correlation between height and weight for adults is +0.40. What proportion (or percent)…
A: Coefficient of determination, r-squared: Coefficient of determination explains the total variation…
Q: 20 23 IN OUT -1 -7 15 )+5 -2 01 8 +15 434 Does your equation model the relationship between all…
A:
Q: 3. If it takes b hours to walk a certain distance at the rate of 3 miles an hour, the number of…
A:
Q: 14. Which of the following is best represented by this equation? TEKS 6.6C y = 1.5x x 2 4 6 8 F. y…
A: Y=1.5x
Q: Assume that in one country in 2005, 12.5% of the population was 65 or older. By 2050, this percent…
A: (A1)
Q: II.) Solve the following problems. Show your solution completely. 1. The average normal daily…
A: We will use the basic knowledge of interpolation to answer this question properly, in detail.
Q: 2000 square feet? A) HousePrice = 58.033+0.033*2000 B) HousePrice = 1.693+3.329*2000 C)…
A: HousePrice = 58.033+0.033*2000
Q: 5. The amount of money Aszir makes at his job is directly proportional to the number of hours Aszir…
A:
Q: Is the following table created with an exponential or a linear equation? Y 1 10 2 13 16 4. 19
A:
Q: eremiah has joined the a Frequent Coffee Buyer program with a local cafe. The program costs $5 per…
A: To define a relationship between the number of cups purchased and the monthly cost
Q: 7. When we model the temperature of a cooling liquid using the equation T = a(b)" +c, we have lear…
A:
Q: A linear relationship exists between the quantities whose values are represented by the variables s…
A: Consider the linear relation between r and s is given by r=as+b. Use the values that describe the…
Q: A linear relationship between EmployeeSalary (Dependent) and degree(independent) has the following…
A:
Q: Patrick is studying the relationship between the number of employees per department and the monthly…
A: The regression line of best fit is given as, y^=0.135x+36.6 We have to find the predicted monthly…
Q: A person scores X = 65 on an exam. Which set of parameters would give this person the worst grade on…
A: Given a person scores x=65 on an example If u=60 ,c =5 And the 7 score corresponding to x=65 is 7…
Q: 2 Which of the following situations represents a non-proportional relationship? A $30 per month and…
A: Here we discuss non-promotional relationship.
Trending now
This is a popular solution!
Step by step
Solved in 3 steps with 2 images
- Find the unknown value. 27. y varies jointly with x and the cube root of 2. If when x=2 and z=27,y=12, find y if x=5 and z=8.REFER TO THE TABLE 1. Find the significant two-tailed. A. 3.97x10⁻⁶ B. 5.97x10⁻⁶C. 4.97x10⁻⁶D. 4.27x10-62. Find the equation that predicts the size if the price is given. A. y=27.789x+105.36B. y=25.789x+105.36C. y=27.789x+115.36D. y=27.129x+105.363. What is the size if the price is 6 millions?A. 270B. 271C. 272 D. 273The following equation describes the relationship between output and labor input at a sample of work stations in a manufacturing plant ŷ = 2.35+2.20X. Suppose, for a selected workstation, the labor input is 5, the predicted output is?
- A teacher finds that for test grades in Class A, x̄ = 32 and S x = 4; for test grades in Class B, x̄ = 32 and S x = 8.a. What score should he predict for students in each class? b. Which class permits the better predictions? Why?A project management consultant estimated that if a particular project was completed t years after completion, N thousand persons would benefit firectly from the project, where N(t)=t3/3-4.5t2+16t 0≤t≤10 for waht value of t will the lagest number of people receive direct benefitsPatrick is studying the relationship between the number of employees per department and the monthly overtime per department and has collected the data shown in the table. The line of best fit for the data is yˆ=0.135x+36.6. Number of Employees 6080100120 Monthly Overtime (Hours) 45475053 According to the line of best fit, what would be the predicted monthly overtime for a department that had 122 employees? Provide your answer below: The predicted monthly overtime is hours.
- In our discussion of Winter’s method, a monthlyseasonality of (say) 0.80 for January means that duringJanuary, air conditioner sales are expected to be 80% of thesales during an average month. An alternative approach tomodeling seasonality is to let the seasonality factor for eachmonth represent how far above average air conditioner saleswill be during the current month. For instance, if sJan 50, then air conditioner sales during January are expectedto be 50 less than air conditioner sales during an averagemonth. If sJuly 90, then air conditioner sales during Julyare expected to be 90 more than air conditioner sales duringan average month. Letst the seasonality for month t after month tdemand is observedLt the estimate of base after month tdemand is observedTt the estimate of trend after month t demandis observedThen the Winter’s method equations given in the text aremodified to be as follows (* indicates multiplication):Lt a * (I ) (1 a) * (Lt1 Tt1)Tt b * (Lt Lt1) (1 b) * Tt1st g *…A business manager determines that t months after production begins on a new product , the number of unit produced will be P thousand, where P(t)=6t2+5t/(t+1)2 What happens to production in the long run?With data from the Social Security Trustees Report for selected years from 1950 and projected to 2030, the number of Social Security beneficiaries (in millions) can be modeled by B(t) = 0.00024t3 − 0.026t2 + 1.6t + 2.2
- 40 - How many of the following are uncertainties? A) 4B) 1C) 3D) 0E) 2These are the same data as in the previous question. Find the value of b2. You should use a computer to find the solution. Y X1 X2 X3 27.6 1 4 4 9.4 3 5 3 15.6 4 7 1 20. 5 5 4 12.3 3 7 3 8.7 5 3 6 7.3 7 5 7 14.9 6 4 8 17.0 5 3 9 -0.8 4 2 0A study shows that the fewer the number of wolves in a rural area (Y), the more farms there are in the area (Y).A classmate argues that the number of farms should be limited because it is damaging the wolf population. Howwould you respond to that conclusion?