100 120 Relar CDP per ega te the S l - 1 In the figure above, GDP per capita relative to the US level for a large group of countries is plotted for years 1970 (in the horizontal axis) and 2000 (in the vertical axis). Which one of the following statements is correct? O Income per capita of countries on the 45 degree line has grown at a similar rate than income per capita of the US in each year. O Income per capita of each country is plotted according to how strongly it correlates to the income per capita of the US in each year. O The income per capita of those countries below the 45 degree line has grown the fastest in between years 1970 and 2000. O The income per capita of those countries on the 45 degree line has not grown in between years 1970 and 2000. ae- ate ad.D
100 120 Relar CDP per ega te the S l - 1 In the figure above, GDP per capita relative to the US level for a large group of countries is plotted for years 1970 (in the horizontal axis) and 2000 (in the vertical axis). Which one of the following statements is correct? O Income per capita of countries on the 45 degree line has grown at a similar rate than income per capita of the US in each year. O Income per capita of each country is plotted according to how strongly it correlates to the income per capita of the US in each year. O The income per capita of those countries below the 45 degree line has grown the fastest in between years 1970 and 2000. O The income per capita of those countries on the 45 degree line has not grown in between years 1970 and 2000. ae- ate ad.D

Principles of Economics 2e
2nd Edition
ISBN:9781947172364
Author:Steven A. Greenlaw; David Shapiro
Publisher:Steven A. Greenlaw; David Shapiro
Chapter19: The Macroeconomic Perspective
Section: Chapter Questions
Problem 25CTQ: Cross country comparisons of GDP per capita typically use purchasing power parity equivalent...

Related questions
Question
Transcribed Image Text:120
100F
NOR
ARE
SGP
CHE
HKG
SWE
TWN
Na.
A
VEN
40
60
80
100
120
Relatiwe GDP per enpita to the US lewel - 1970
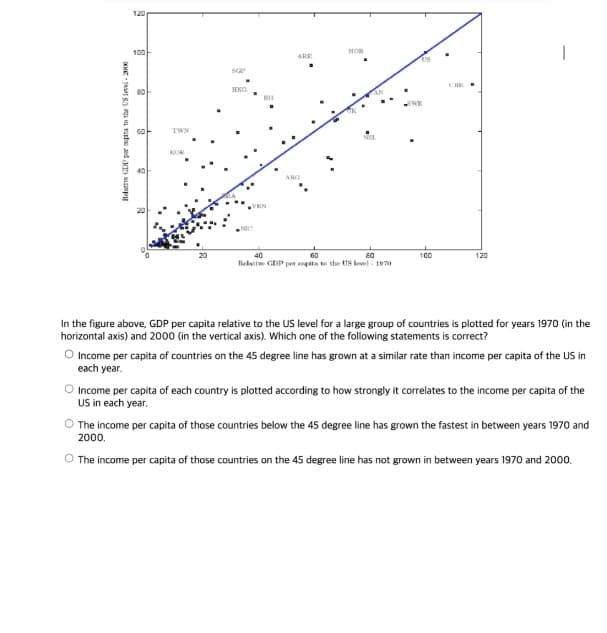
In the figure above, GDP per capita relative to the US level for a large group of countries is plotted for years 1970 (in the
horizontal axis) and 2000 (in the vertical axis). Which one of the following statements is correct?
O Income per capita of countries on the 45 degree line has grown at a similar rate than income per capita of the US in
each year.
O Income per capita of each country is plotted according to how strongly it correlates to the income per capita of the
US in each year.
O The income per capita of those countries below the 45 degree line has grown the fastest in between years 1970 and
20
O The income per capita of those countries on the 45 degree line has not grown in between years 1970 and 2000.
Expert Solution
This question has been solved!
Explore an expertly crafted, step-by-step solution for a thorough understanding of key concepts.

Step by step
Solved in 2 steps

Recommended textbooks for you
Principles of Economics 2e
Economics
ISBN:
9781947172364
Author:
Steven A. Greenlaw; David Shapiro
Publisher:
OpenStax

Brief Principles of Macroeconomics (MindTap Cours…
Economics
ISBN:
9781337091985
Author:
N. Gregory Mankiw
Publisher:
Cengage Learning

Essentials of Economics (MindTap Course List)
Economics
ISBN:
9781337091992
Author:
N. Gregory Mankiw
Publisher:
Cengage Learning
Principles of Economics 2e
Economics
ISBN:
9781947172364
Author:
Steven A. Greenlaw; David Shapiro
Publisher:
OpenStax
Brief Principles of Macroeconomics (MindTap Cours…
Economics
ISBN:
9781337091985
Author:
N. Gregory Mankiw
Publisher:
Cengage Learning
Essentials of Economics (MindTap Course List)
Economics
ISBN:
9781337091992
Author:
N. Gregory Mankiw
Publisher:
Cengage Learning
