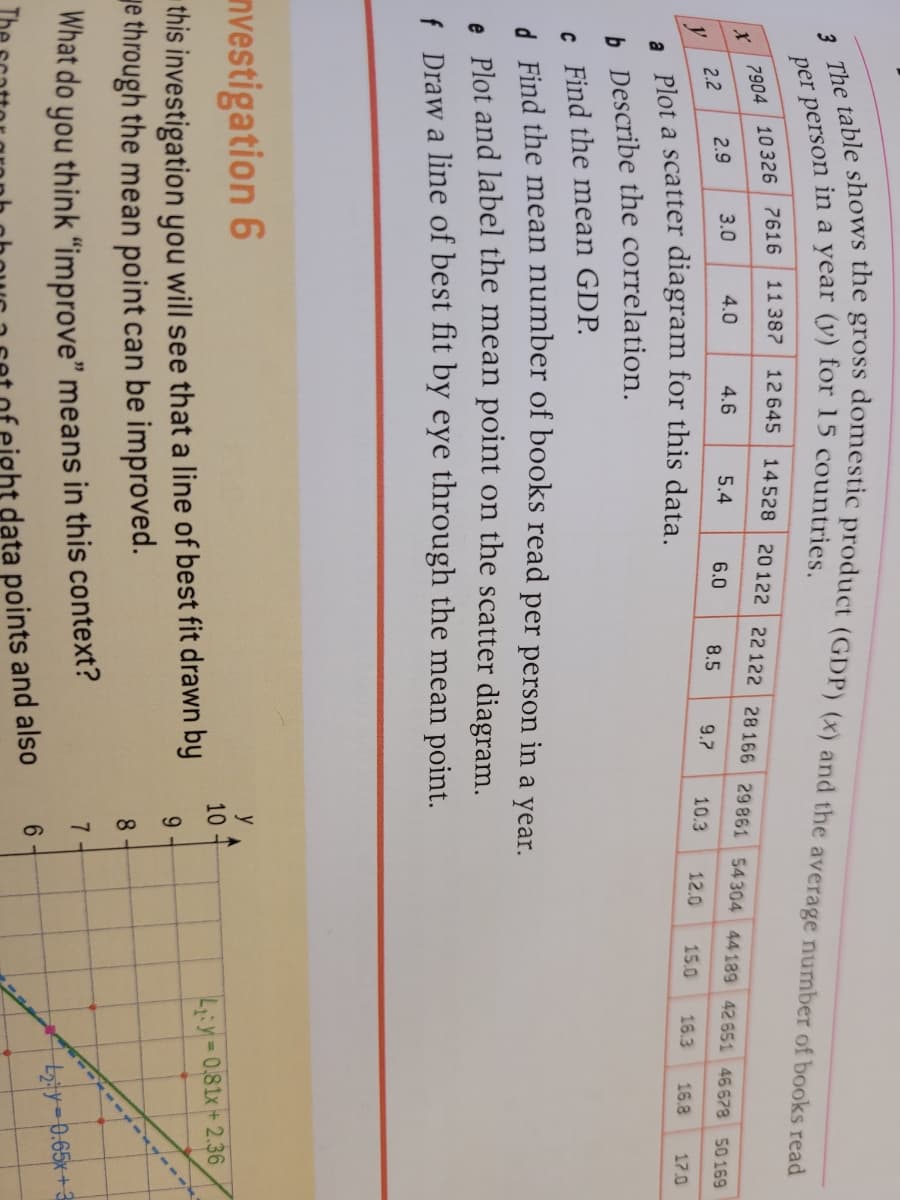
11 387 12 645 14528 20 122 22 122 28 166 29861 54304 44 189 42 651 46678 50 169 7904 10 326 7616 2.9 3.0 4.0 4.6 5.4 6.0 2.2 8.5 9.7 10.3 12.0 15.0 16.3 16.8 17.0 Plot a scatter diagram for this data. a b Describe the correlation. c Find the mean GDP. 4. Find the mean number of books read per person in a year. . Plot and label the mean point on the scatter diagram. f Draw a line of best fit by eye through the mean point.
11 387 12 645 14528 20 122 22 122 28 166 29861 54304 44 189 42 651 46678 50 169 7904 10 326 7616 2.9 3.0 4.0 4.6 5.4 6.0 2.2 8.5 9.7 10.3 12.0 15.0 16.3 16.8 17.0 Plot a scatter diagram for this data. a b Describe the correlation. c Find the mean GDP. 4. Find the mean number of books read per person in a year. . Plot and label the mean point on the scatter diagram. f Draw a line of best fit by eye through the mean point.

Glencoe Algebra 1, Student Edition, 9780079039897, 0079039898, 2018
18th Edition
ISBN:9780079039897
Author:Carter
Publisher:Carter
Chapter4: Equations Of Linear Functions
Section4.5: Correlation And Causation
Problem 21PFA

Related questions
Question
Transcribed Image Text:r7904 10 326 7616
3.0
11 387 12 645
14 528 20 122
22 122 28 166 29 861 54304 44189 42 651 46678 50 169
2.9
4.0
4.6
5.4
6.0
2.2
y
8.5
9.7
10.3
12.0
15.0
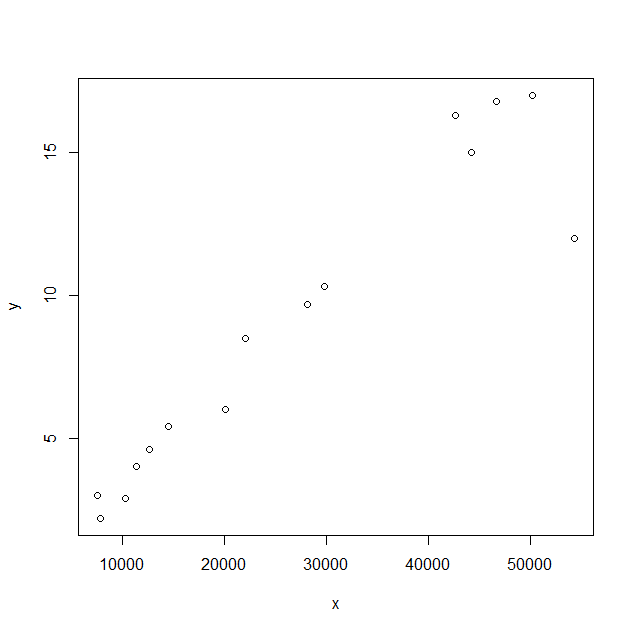
a Plot a scatter diagram for this data.
16.3
16.8
17.0
b Describe the correlation.
c Find the mean GDP.
4. Find the mean number of books read per person in a year.
e Plot and label the mean point on the scatter diagram.
f Draw a line of best fit by eye through the mean point.
nvestigation 6
y
10
L:y=0,81x + 2.36
%D
this investigation you will see that a line of best fit drawn by
ye through the mean point can be improved.
9.
8
What do you think "improve" means in this context?
00.65x+3
6.
ight data points and also
Expert Solution
Step 1
Scatterplot

Step by step
Solved in 2 steps with 2 images

Recommended textbooks for you
Glencoe Algebra 1, Student Edition, 9780079039897…
Algebra
ISBN:
9780079039897
Author:
Carter
Publisher:
McGraw Hill

Big Ideas Math A Bridge To Success Algebra 1: Stu…
Algebra
ISBN:
9781680331141
Author:
HOUGHTON MIFFLIN HARCOURT
Publisher:
Houghton Mifflin Harcourt
Glencoe Algebra 1, Student Edition, 9780079039897…
Algebra
ISBN:
9780079039897
Author:
Carter
Publisher:
McGraw Hill
Big Ideas Math A Bridge To Success Algebra 1: Stu…
Algebra
ISBN:
9781680331141
Author:
HOUGHTON MIFFLIN HARCOURT
Publisher:
Houghton Mifflin Harcourt