11. A population consists of the data (1, 2, 3, 4). 4. How many different samples of size n = 2 can be drawn from the population? a. 6 b. 5 c. 4 d. 3 For numbers 12-14, please refer to the problem below. A population consists of five (5) measurements 2, 3, 6, 5, and 7. 12. How many different samples of size n = 2 can be drawn from the population? a. 7 b. 8 c. 9 d. 10 13. What is the mean of the sampling distribution of the sample means? a. 3.44 b. 4.60 c. 4.92 d. 5.20
11. A population consists of the data (1, 2, 3, 4). 4. How many different samples of size n = 2 can be drawn from the population? a. 6 b. 5 c. 4 d. 3 For numbers 12-14, please refer to the problem below. A population consists of five (5) measurements 2, 3, 6, 5, and 7. 12. How many different samples of size n = 2 can be drawn from the population? a. 7 b. 8 c. 9 d. 10 13. What is the mean of the sampling distribution of the sample means? a. 3.44 b. 4.60 c. 4.92 d. 5.20

Linear Algebra: A Modern Introduction
4th Edition
ISBN:9781285463247
Author:David Poole
Publisher:David Poole
Chapter2: Systems Of Linear Equations
Section2.4: Applications
Problem 1EQ: 1. Suppose that, in Example 2.27, 400 units of food A, 600 units of B, and 600 units of C are placed...

Related questions
Question
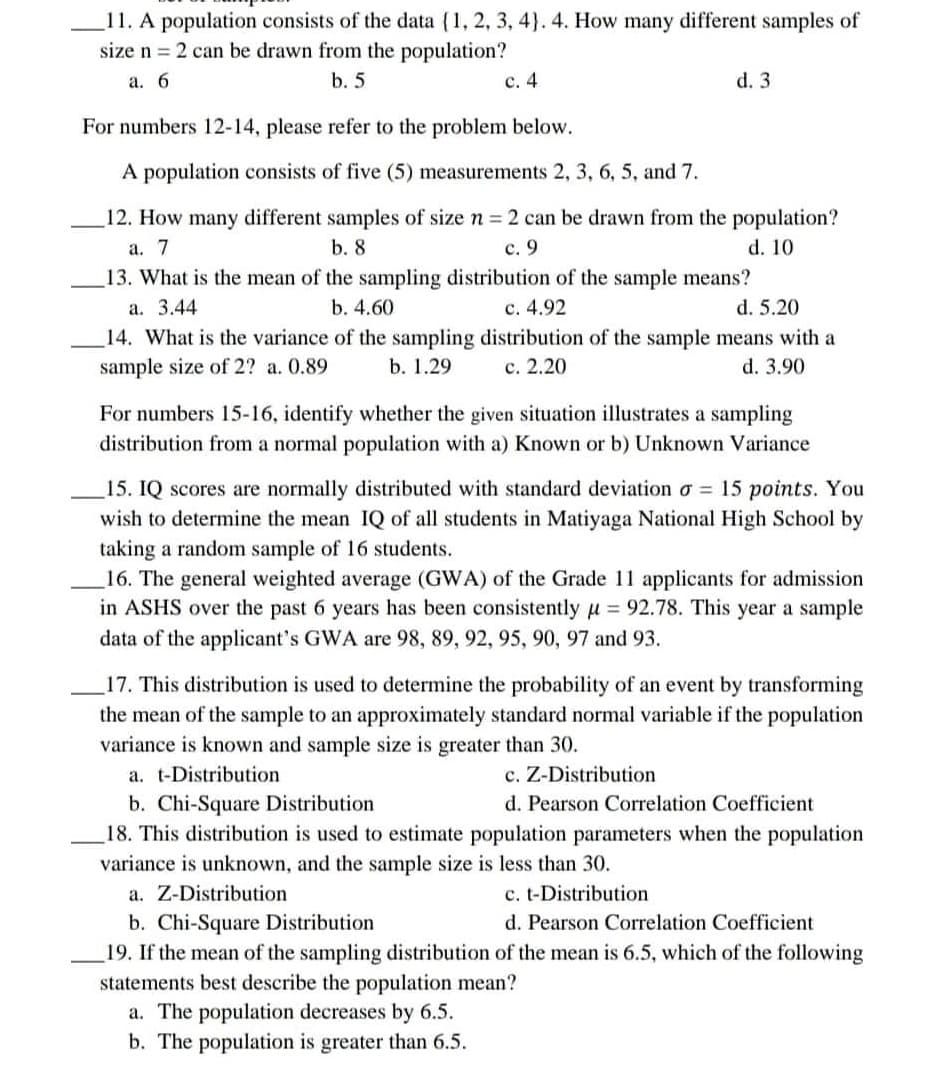
Transcribed Image Text:11. A population consists of the data (1, 2, 3, 4). 4. How many different samples of
size n = 2 can be drawn from the population?
a. 6
b. 5
c. 4
d. 3
For numbers 12-14, please refer to the problem below.
A population consists of five (5) measurements 2, 3, 6, 5, and 7.
12. How many different samples of size n = 2 can be drawn from the population?
a. 7
b. 8
c. 9
d. 10
13. What is the mean of the sampling distribution of the sample means?
a. 3.44
b. 4.60
c. 4.92
d. 5.20
14. What is the variance of the sampling distribution of the sample means with a
sample size of 2? a. 0.89
b. 1.29
c. 2.20
d. 3.90
For numbers 15-16, identify whether the given situation illustrates a sampling
distribution from a normal population with a) Known or b) Unknown Variance
15. IQ scores are normally distributed with standard deviation o= 15 points. You
wish to determine the mean IQ of all students in Matiyaga National High School by
taking a random sample of 16 students.
16. The general weighted average (GWA) of the Grade 11 applicants for admission
in ASHS over the past 6 years has been consistently μ = 92.78. This year a sample
data of the applicant's GWA are 98, 89, 92, 95, 90, 97 and 93.
17. This distribution is used to determine the probability of an event by transforming
the mean of the sample to an approximately standard normal variable if the population
variance is known and sample size is greater than 30.
a. t-Distribution
c. Z-Distribution
b. Chi-Square Distribution
d. Pearson Correlation Coefficient
18. This distribution is used to estimate population parameters when the population
variance is unknown, and the sample size is less than 30.
a. Z-Distribution
c. t-Distribution
b. Chi-Square Distribution
d. Pearson Correlation Coefficient
19. If the mean of the sampling distribution of the mean is 6.5, which of the following
statements best describe the population mean?
a. The population decreases by 6.5.
b. The population is greater than 6.5.
Expert Solution
This question has been solved!
Explore an expertly crafted, step-by-step solution for a thorough understanding of key concepts.

Step by step
Solved in 4 steps

Recommended textbooks for you
Linear Algebra: A Modern Introduction
Algebra
ISBN:
9781285463247
Author:
David Poole
Publisher:
Cengage Learning
Linear Algebra: A Modern Introduction
Algebra
ISBN:
9781285463247
Author:
David Poole
Publisher:
Cengage Learning