11. z Scores: Red Blood Cell Count Let x = red blood cell (RBC) count in millions per cubic millimeter of whole blood. For healthy females, x has an approximately normal distribution with mean = 4.8 and standard devia- tion = 0.3 (based on information from Diagnostic Tests with Nursing Implications, edited by S. Loeb, Springhouse Press). Convert each of the following x intervals to z intervals. (a) 4.5 < x (b) x < 4.2 (c) 4.0
11. z Scores: Red Blood Cell Count Let x = red blood cell (RBC) count in millions per cubic millimeter of whole blood. For healthy females, x has an approximately normal distribution with mean = 4.8 and standard devia- tion = 0.3 (based on information from Diagnostic Tests with Nursing Implications, edited by S. Loeb, Springhouse Press). Convert each of the following x intervals to z intervals. (a) 4.5 < x (b) x < 4.2 (c) 4.0

Algebra & Trigonometry with Analytic Geometry
13th Edition
ISBN:9781133382119
Author:Swokowski
Publisher:Swokowski
Chapter5: Inverse, Exponential, And Logarithmic Functions
Section5.6: Exponential And Logarithmic Equations
Problem 64E

Related questions
Question
100%
Transcribed Image Text:8:48
←
Brase Worksheet 7.2 - Saved
←
...| 9%
This document contains ink, shapes an...
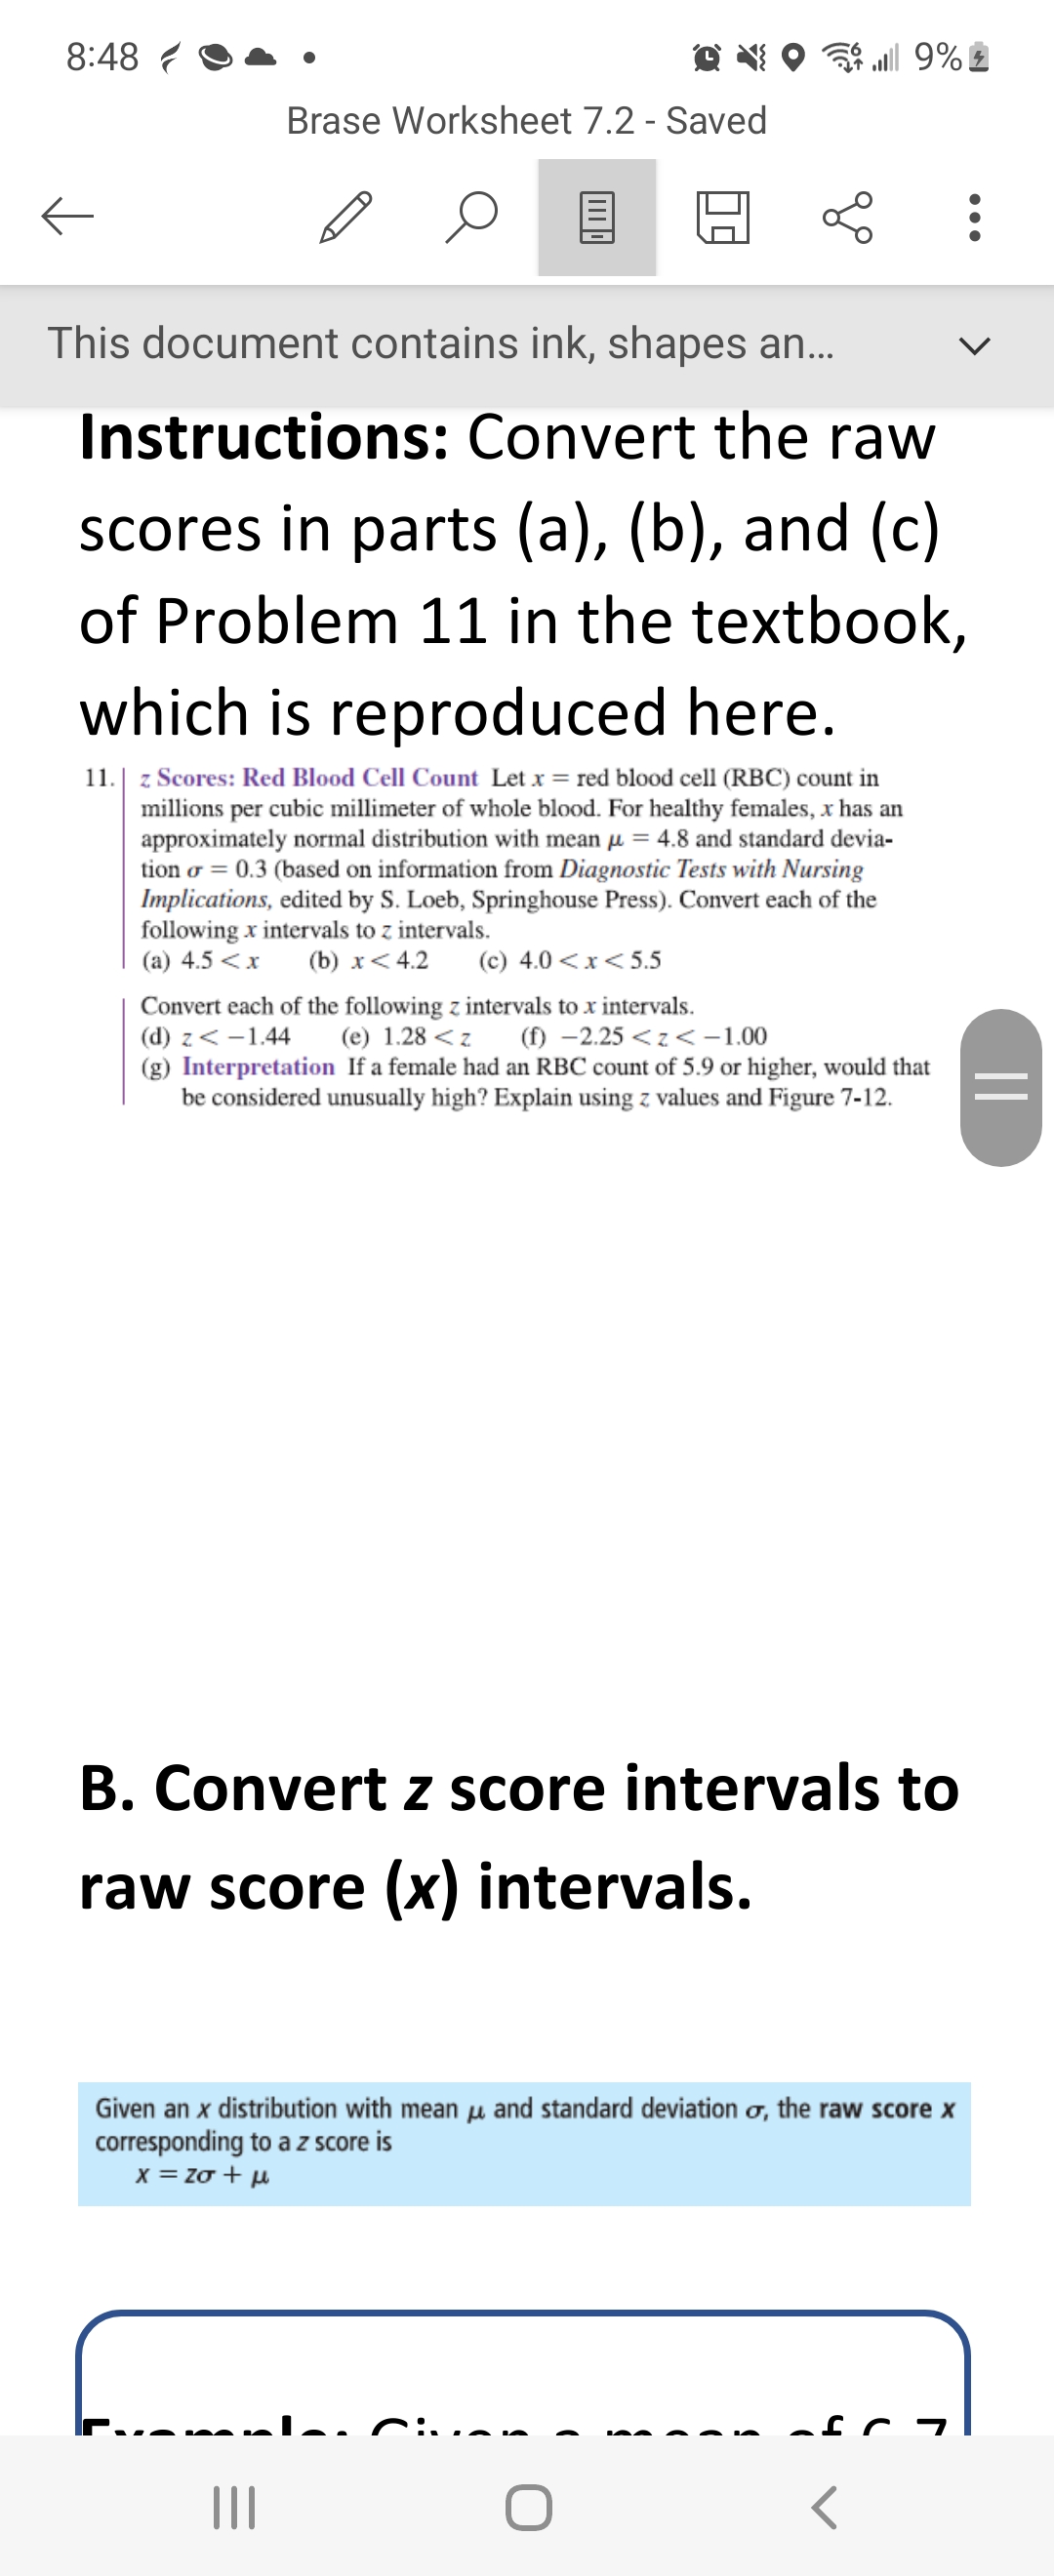
Instructions: Convert the raw
scores in parts (a), (b), and (c)
of Problem 11 in the textbook,
which is reproduced here.
11.
z Scores: Red Blood Cell Count Let x = red blood cell (RBC) count in
millions per cubic millimeter of whole blood. For healthy females, x has an
approximately normal distribution with mean = 4.8 and standard devia-
tion = 0.3 (based on information from Diagnostic Tests with Nursing
Implications, edited by S. Loeb, Springhouse Press). Convert each of the
following x intervals to z intervals.
(a) 4.5 < x (b) x < 4.2 (c) 4.0<x<5.5
Convert each of the following z intervals to x intervals.
(d) z < -1.44 (e) 1.28 <z
(f) -2.25<z<-1.00
(g) Interpretation If a female had an RBC count of 5.9 or higher, would that
be considered unusually high? Explain using z values and Figure 7-12.
|||
B. Convert z score intervals to
raw score (x) intervals.
Given an x distribution with mean and standard deviation o, the raw score x
corresponding to a z score is
x=20 tu
:
||
Transcribed Image Text:8:59
←
Q
Brase Worksheet 7.2 - Saved
←
This document contains ink, shapes an...
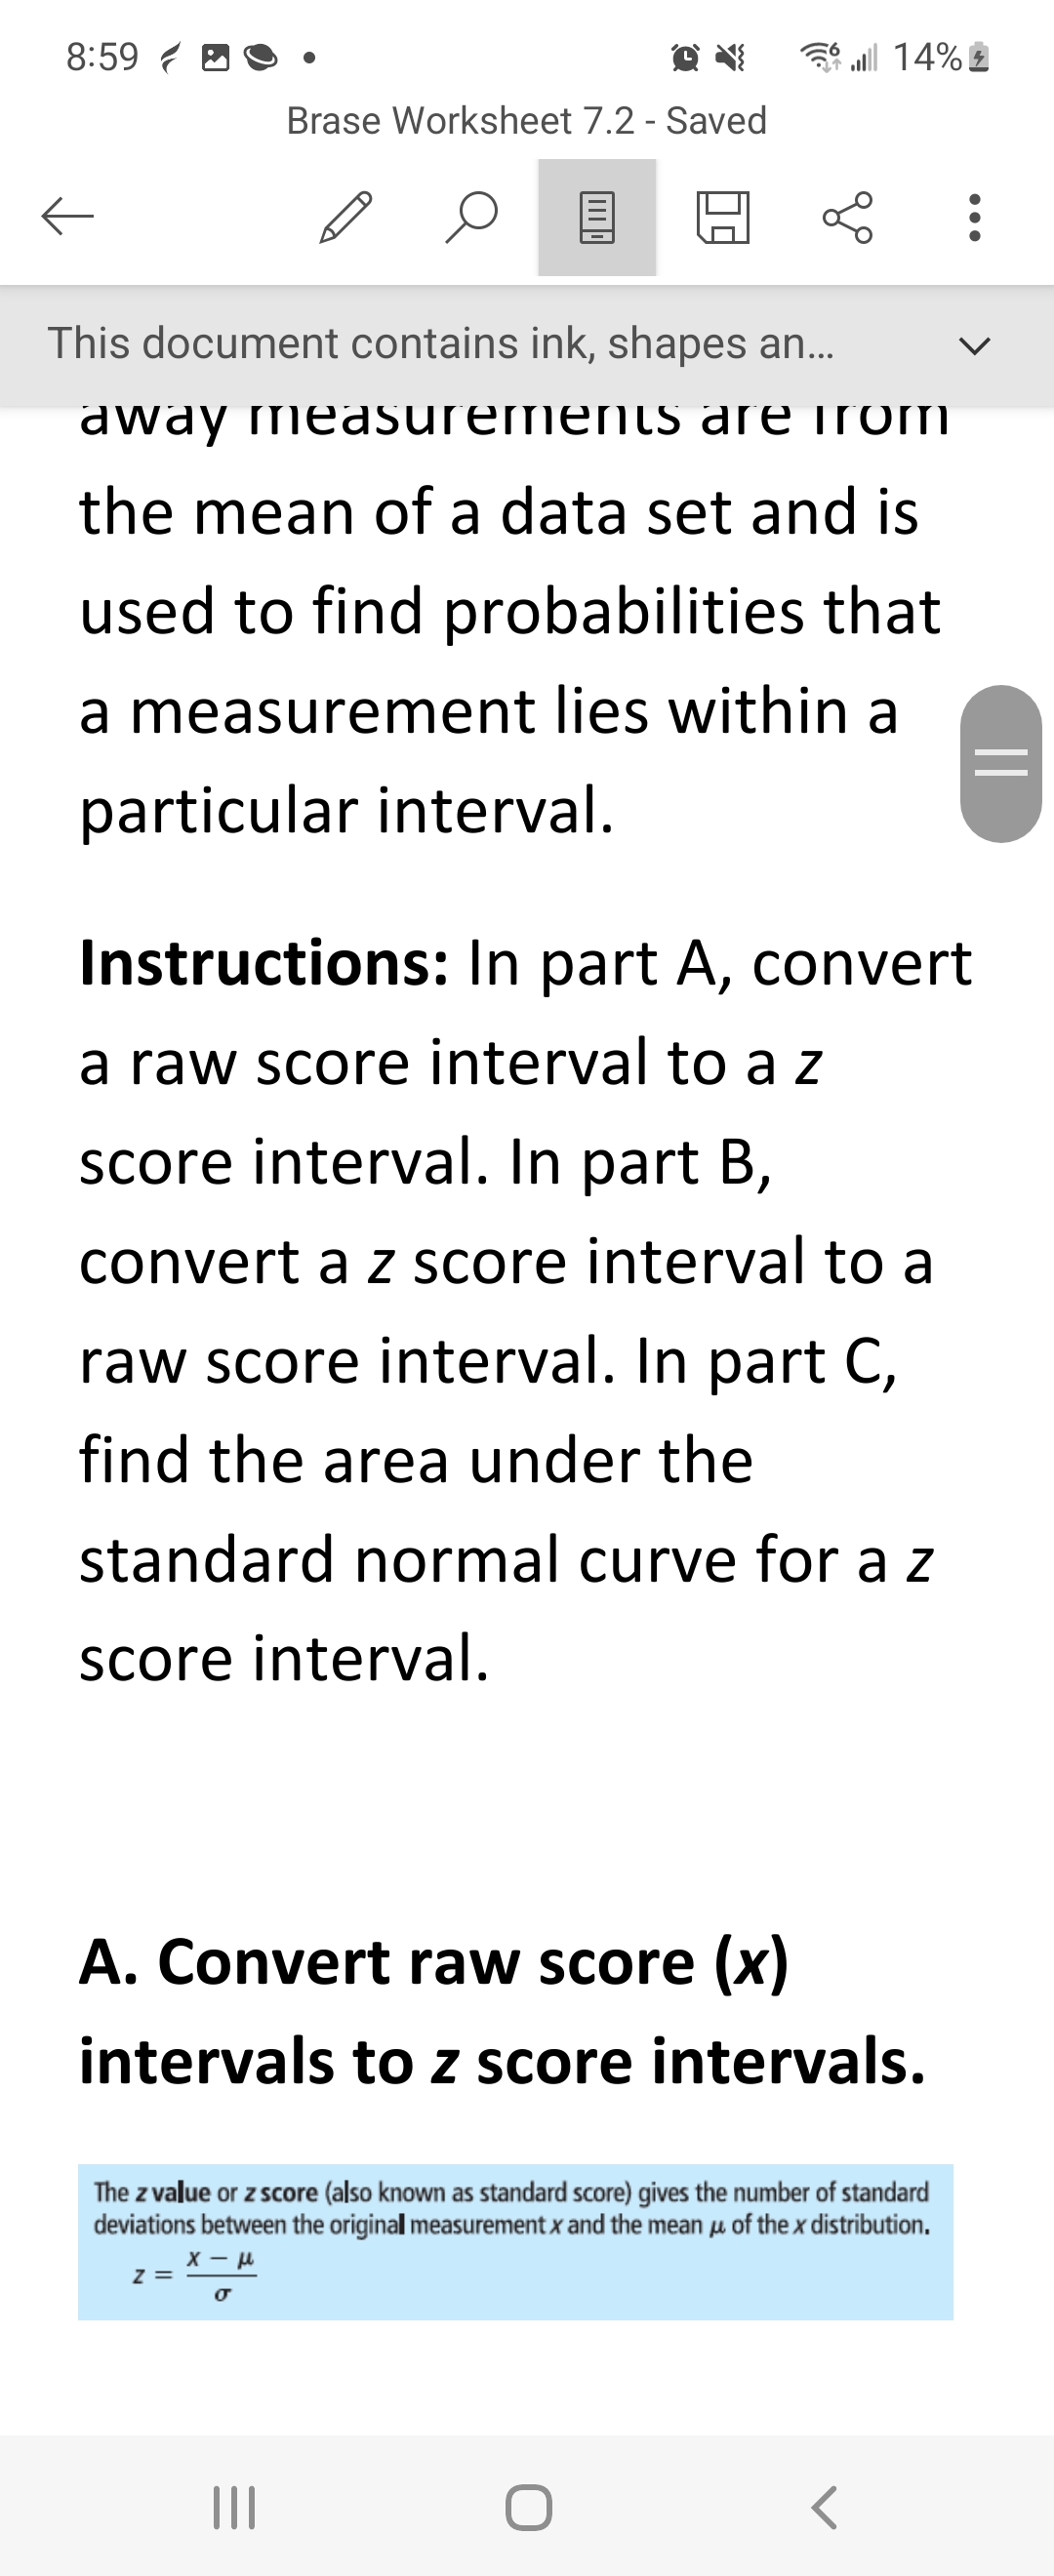
away measurements are from
the mean of a data set and is
used to find probabilities that
a measurement lies within a
particular interval.
Instructions: In part A, convert
a raw score interval to a z
score interval. In part B,
convert a z score interval to a
raw score interval. In part C,
find the area under the
standard normal curve for a z
score interval.
Z =
14% ال
A. Convert raw score (x)
intervals to z score intervals.
|||
The z vallue or z score (also known as standard score) gives the number of standard
deviations between the original measurement x and the mean of the x distribution.
x-μ
<
:
||
Expert Solution
This question has been solved!
Explore an expertly crafted, step-by-step solution for a thorough understanding of key concepts.

This is a popular solution!

Trending now
This is a popular solution!

Step by step
Solved in 4 steps

Recommended textbooks for you
Algebra & Trigonometry with Analytic Geometry
Algebra
ISBN:
9781133382119
Author:
Swokowski
Publisher:
Cengage

Glencoe Algebra 1, Student Edition, 9780079039897…
Algebra
ISBN:
9780079039897
Author:
Carter
Publisher:
McGraw Hill

Trigonometry (MindTap Course List)
Trigonometry
ISBN:
9781337278461
Author:
Ron Larson
Publisher:
Cengage Learning
Algebra & Trigonometry with Analytic Geometry
Algebra
ISBN:
9781133382119
Author:
Swokowski
Publisher:
Cengage
Glencoe Algebra 1, Student Edition, 9780079039897…
Algebra
ISBN:
9780079039897
Author:
Carter
Publisher:
McGraw Hill
Trigonometry (MindTap Course List)
Trigonometry
ISBN:
9781337278461
Author:
Ron Larson
Publisher:
Cengage Learning