11.1.15-T The table below lists the number of games played in a yearly best-of-seven baseball championship series, along with the expected proportions for the number of games played with teams of equal abilities. Use a 0.05 significance level to test the claim that the actual numbers of games fit the distribution indicated by the expected proportions. 7 Games Played Actual contests 19 21 20 36 Expected proportion 16 16 16 16 Ho: The observed frequencies agree with the expected proportions. H: At least one of the observed frequencies do not agree with the expected proportions. Calculate the test statistic, x. =(Round to three decimal places as needed.) ok Answer
11.1.15-T The table below lists the number of games played in a yearly best-of-seven baseball championship series, along with the expected proportions for the number of games played with teams of equal abilities. Use a 0.05 significance level to test the claim that the actual numbers of games fit the distribution indicated by the expected proportions. 7 Games Played Actual contests 19 21 20 36 Expected proportion 16 16 16 16 Ho: The observed frequencies agree with the expected proportions. H: At least one of the observed frequencies do not agree with the expected proportions. Calculate the test statistic, x. =(Round to three decimal places as needed.) ok Answer

Glencoe Algebra 1, Student Edition, 9780079039897, 0079039898, 2018
18th Edition
ISBN:9780079039897
Author:Carter
Publisher:Carter
Chapter10: Statistics
Section10.4: Distributions Of Data
Problem 19PFA

Related questions
Topic Video
Question
Calculate the test statistic x2 and the pvalue
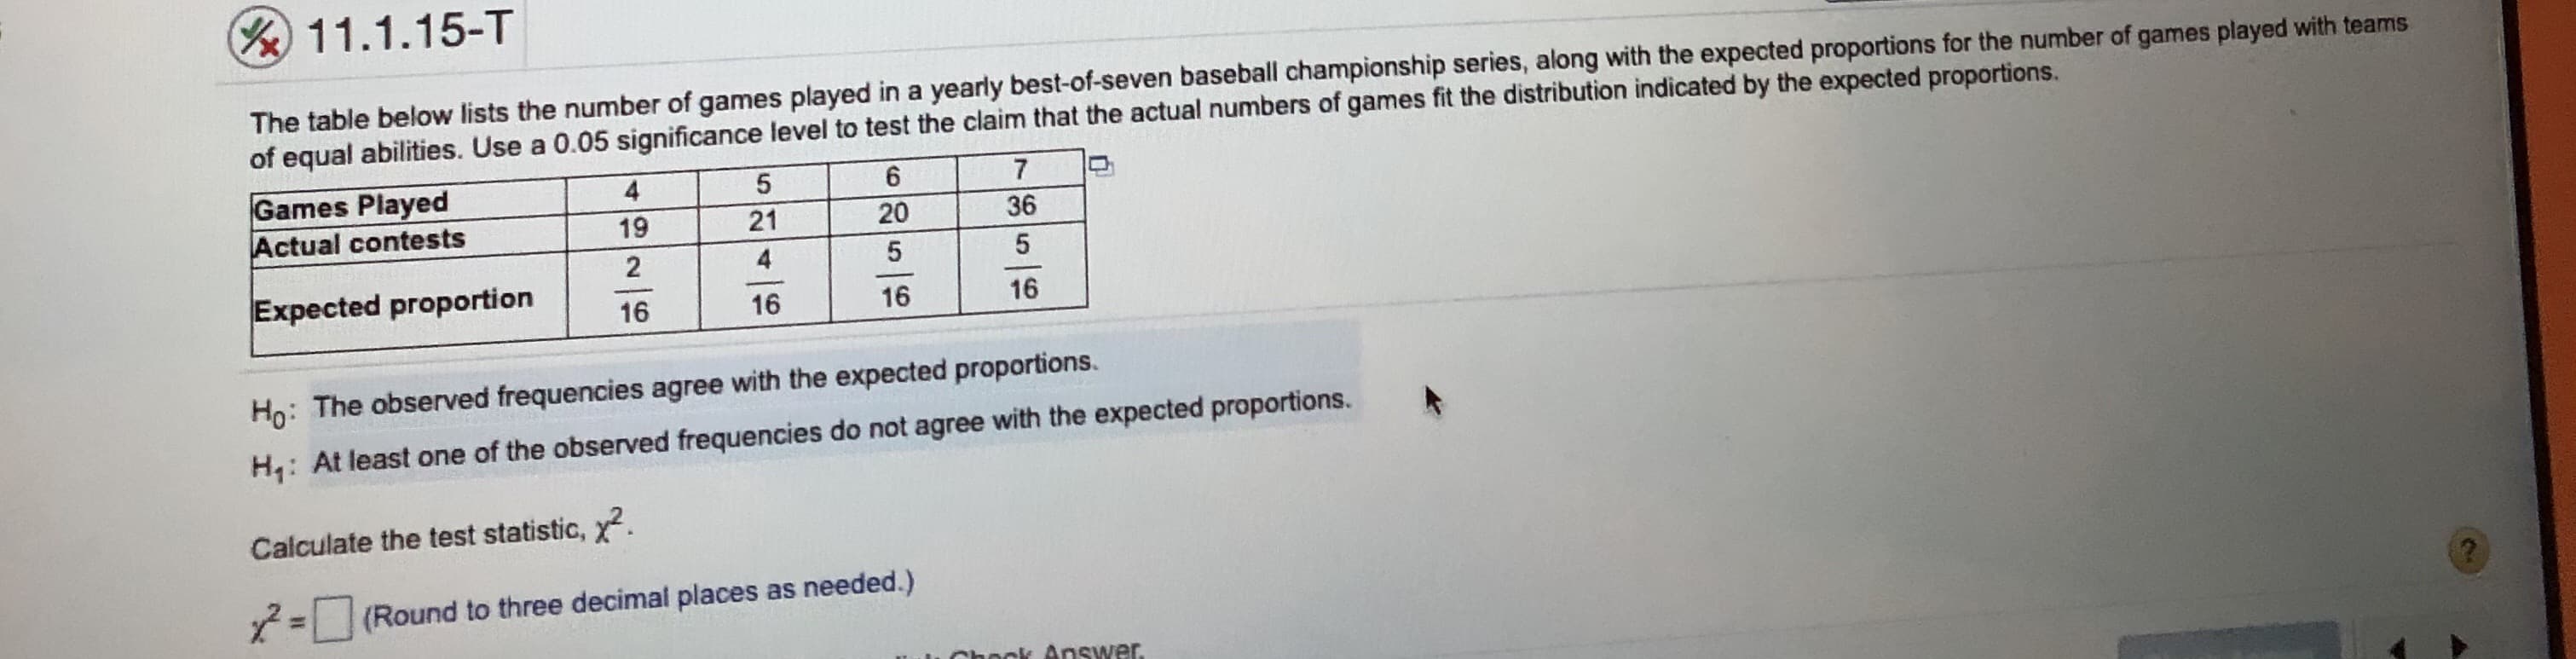
Transcribed Image Text:11.1.15-T
The table below lists the number of games played in a yearly best-of-seven baseball championship series, along with the expected proportions for the number of games played with teams
of equal abilities. Use a 0.05 significance level to test the claim that the actual numbers of games fit the distribution indicated by the expected proportions.
7
Games Played
Actual contests
19
21
20
36
Expected proportion
16
16
16
16
Ho: The observed frequencies agree with the expected proportions.
H: At least one of the observed frequencies do not agree with the expected proportions.
Calculate the test statistic, x.
=(Round to three decimal places as needed.)
ok Answer
Expert Solution
This question has been solved!
Explore an expertly crafted, step-by-step solution for a thorough understanding of key concepts.

This is a popular solution!

Trending now
This is a popular solution!

Step by step
Solved in 4 steps with 11 images

Knowledge Booster


Learn more about
Need a deep-dive on the concept behind this application? Look no further. Learn more about this topic, statistics and related others by exploring similar questions and additional content below.Recommended textbooks for you
Glencoe Algebra 1, Student Edition, 9780079039897…
Algebra
ISBN:
9780079039897
Author:
Carter
Publisher:
McGraw Hill

Holt Mcdougal Larson Pre-algebra: Student Edition…
Algebra
ISBN:
9780547587776
Author:
HOLT MCDOUGAL
Publisher:
HOLT MCDOUGAL
Glencoe Algebra 1, Student Edition, 9780079039897…
Algebra
ISBN:
9780079039897
Author:
Carter
Publisher:
McGraw Hill
Holt Mcdougal Larson Pre-algebra: Student Edition…
Algebra
ISBN:
9780547587776
Author:
HOLT MCDOUGAL
Publisher:
HOLT MCDOUGAL