11:17 The following data represent the dividend yields (in percent) of a random sample of 28 publicly traded stocks. Complete parts (a) to (c). (a) Compute the five-number summary. The five-number summary is ‒‒‒‒‒ (Round to two decimal places as needed. Use ascending order.) (b) Draw a boxplot of the data. O A. O B. 2.43 0.17 1.57 2.4 0.2 0 1 (c) Determine the shape of the distribution from the boxplot. 2.44 0.44 1.13 3.61 1.91 0 0 OA. The distribution is skewed to the right. B. The distribution is skewed to the left. OC. The distribution is roughly symmetric. D. The shape of the distribution cannot be determined from the boxplot. VO) 1 LTE2.II 4G 0.18 0.31 0.71 0 0.33 2.2 2.26 2.5 O C. 3 2.79 3 3 2.43 53% 0.88 0.21 0 0.31 Q
11:17 The following data represent the dividend yields (in percent) of a random sample of 28 publicly traded stocks. Complete parts (a) to (c). (a) Compute the five-number summary. The five-number summary is ‒‒‒‒‒ (Round to two decimal places as needed. Use ascending order.) (b) Draw a boxplot of the data. O A. O B. 2.43 0.17 1.57 2.4 0.2 0 1 (c) Determine the shape of the distribution from the boxplot. 2.44 0.44 1.13 3.61 1.91 0 0 OA. The distribution is skewed to the right. B. The distribution is skewed to the left. OC. The distribution is roughly symmetric. D. The shape of the distribution cannot be determined from the boxplot. VO) 1 LTE2.II 4G 0.18 0.31 0.71 0 0.33 2.2 2.26 2.5 O C. 3 2.79 3 3 2.43 53% 0.88 0.21 0 0.31 Q

Glencoe Algebra 1, Student Edition, 9780079039897, 0079039898, 2018
18th Edition
ISBN:9780079039897
Author:Carter
Publisher:Carter
Chapter10: Statistics
Section10.1: Measures Of Center
Problem 14PPS

Related questions
Question
Transcribed Image Text:K
11:17
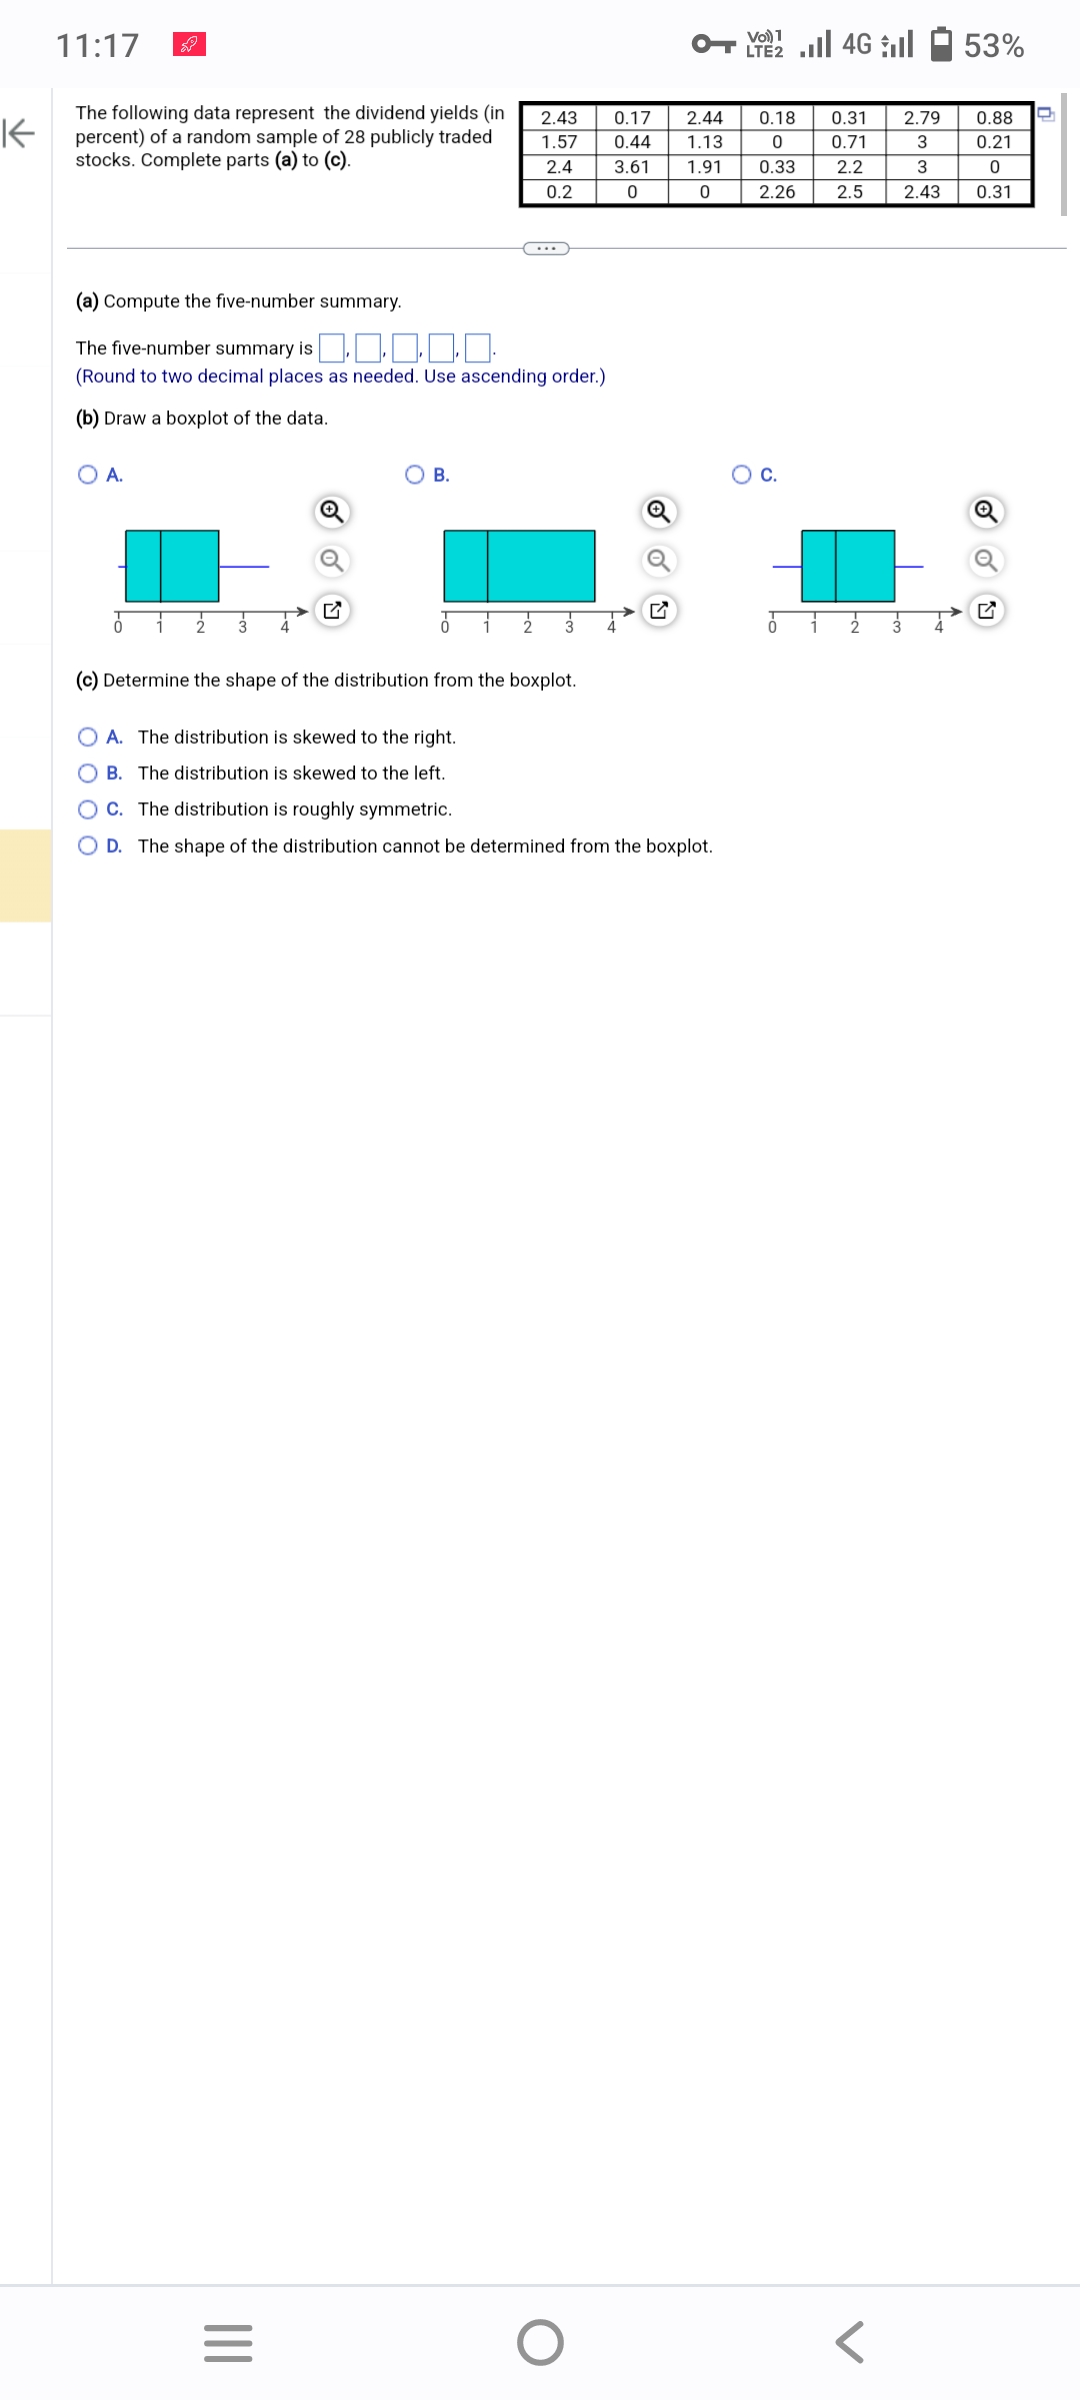
The following data represent the dividend yields (in
percent) of a random sample of 28 publicly traded
stocks. Complete parts (a) to (c).
(a) Compute the five-number summary.
The five-number summary is ...
(Round to two decimal places as needed. Use ascending order.)
(b) Draw a boxplot of the data.
O A.
1 2 3
B.
|||
0 1
O A. The distribution is skewed to the right.
OB. The distribution is skewed to the left.
OC. The distribution is roughly symmetric.
D. The shape of the
=
2
(c) Determine the shape of the distribution from the boxplot.
2.43 0.17
1.57
2.4
0.2
3
2.44 0.18
0.44 1.13
3.61 1.91
0
0.33
0
0
2.26
distribution cannot be determined from the boxplot.
O
LTE2
O C.
0.31 2.79
0.71
3
2.2
3
2.5
2.43
2
53%
0.88 Q
0.21
0
0.31
Expert Solution
This question has been solved!
Explore an expertly crafted, step-by-step solution for a thorough understanding of key concepts.

Step by step
Solved in 4 steps with 1 images

Recommended textbooks for you
Glencoe Algebra 1, Student Edition, 9780079039897…
Algebra
ISBN:
9780079039897
Author:
Carter
Publisher:
McGraw Hill

Algebra & Trigonometry with Analytic Geometry
Algebra
ISBN:
9781133382119
Author:
Swokowski
Publisher:
Cengage
Glencoe Algebra 1, Student Edition, 9780079039897…
Algebra
ISBN:
9780079039897
Author:
Carter
Publisher:
McGraw Hill
Algebra & Trigonometry with Analytic Geometry
Algebra
ISBN:
9781133382119
Author:
Swokowski
Publisher:
Cengage